Over the past six months, Bitcoin exchange reserves fell by 400,000 BTC, according to on-chain data from CryptoQuant. A chart shared by Crypto Rover on June 16 shows reserves dropped from around 2.8 million BTC in late December 2024 to 2.4 million by mid-June 2025.
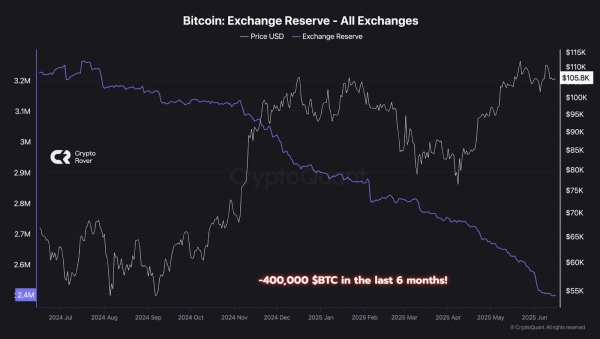 Bitcoin: Exchange Reserve – All Exchanges. Source: CryptoQuant / X
During the same period, Bitcoin’s price increased from below $70,000 to over $105,000. The chart shows an inverse pattern between price and supply on exchanges, with assets moving off platforms while the price climbed.
Lower Exchange Balances May Trigger Volatility
The data from CryptoQuant shows that Bitcoin’s availability on exchanges reached its lowest point in over a year. This trend intensified during May and June 2025. At the same time, the price showed stronger gains, with the upward movement accelerating past the $90,000 mark.
This timing suggests that large investors may have added to their positions as price momentum returned. The continued drop in available supply creates conditions that could magnify the impact of new demand.
Analysts Confirm Supply Shift to Private Wallets
Sjuul Follings of Traders Union confirmed the data, noting that the decrease points to reduced trading supply.
CoinQuest echoed the trend, stating the sharp decline may create a supply crunch if demand picks up. The post emphasized that large holders appear to be accumulating Bitcoin during periods of market hesitation.
The change in behavior reduces the number of coins available for quick trading. It also shifts market dynamics, potentially increasing sensitivity to future price swings.
Bitcoin’s Chart Forms a Classic “Bullish Pennant” Pattern
At the same time, Bitcoin’s daily price chart has formed a “bullish pennant.” on the 1-day chart published on TradingView. A bullish pennant appears when price consolidates in a narrowing range following a sharp upward move, signaling potential continuation of the trend once price breaks above the upper resistance.
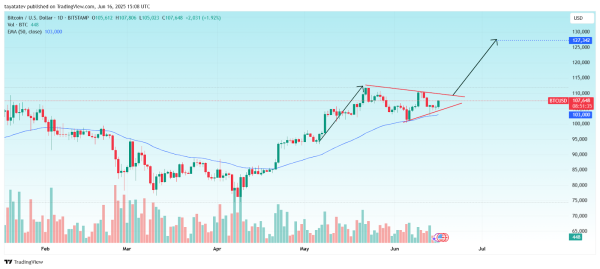 Bitcoin / U.S. Dollar – 1D (Daily). Source: TradingView
In this case, Bitcoin trades at $107,648. If this pattern confirms, the projected breakout target stands at approximately $127,342. This target reflects an 18 percent increase from the current price, matching the height of the previous rally before consolidation.
The candlestick structure shows higher lows and lower highs forming a symmetrical triangle. This shape follows a clear upward flagpole that started in late April and peaked in early May. The pattern sits above the 50-day Exponential Moving Average (EMA), currently positioned at $103,000. Price holding above this level supports the bullish case.
Volume has declined during the consolidation, which is typical for a pennant structure. A breakout above the upper red trendline, ideally supported by increased trading volume, would confirm the bullish continuation.
If confirmed, Bitcoin may resume its previous uptrend and reach the projected target. However, the breakout needs strong momentum to sustain the move past immediate resistance near $110,000.
Disclaimer: The information presented in this article is for informational and educational purposes only. The article does not constitute financial advice or advice of any kind. Coin Edition is not responsible for any losses incurred as a result of the utilization of content, products, or services mentioned. Readers are advised to exercise caution before taking any action related to the company.