Bitcoin’s price on February 9, 2025, stood at $96,413. It has a market cap of $1.911 trillion, a 24-hour trade volume of around $23.62 billion, and an intraday price range between $95,782 and $97,317.
Bitcoin
Bitcoin‘s 1-hour chart reflects a period of consolidation following a drop from a local high of $100,185 to a low of $95,662. Support appears firm in the $95,500–$96,000 range, while resistance is forming between $98,000 and $99,500. Recent volume spikes indicate the potential for increased volatility, with a break above $98,500 likely to push prices toward $100,000. However, failure to hold $95,500 could open the door for further declines toward $92,000.
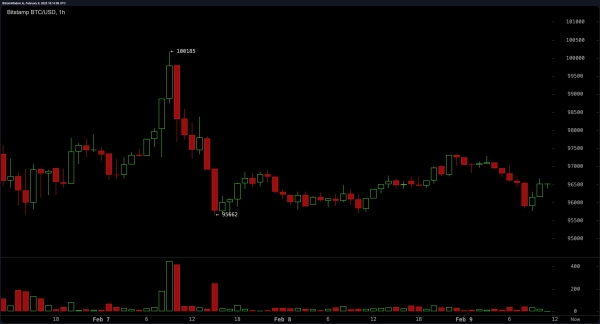 BTC/USD 1H on Feb. 9, 2025
The 4-hour chart suggests a short-term downtrend, with bitcoin forming lower highs and lower lows after peaking at $106,447. Support is evident between $91,500 and $92,500, while resistance remains strong around $98,500–$100,000. Selling volume has increased, reinforcing bearish sentiment. A move above $98,000 with significant volume could signal a reversal, but rejection at these levels could push bitcoin toward a retest of lower support zones.
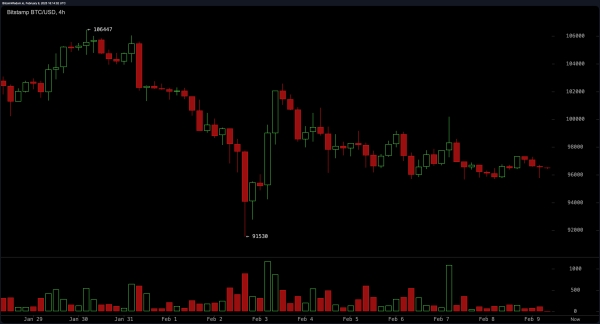 BTC/USD 4H on Feb. 9, 2025
On the daily chart, bitcoin is experiencing a pullback after reaching a high of $109,356, with key support in the $89,164–$92,000 region and resistance at $106,000–$109,000. Declining volume suggests weakening buying momentum, making a drop toward support possible unless bullish pressure returns. A breakout above $102,000 would indicate a shift in sentiment, while failure to hold above $95,500 increases the likelihood of further downside movement.
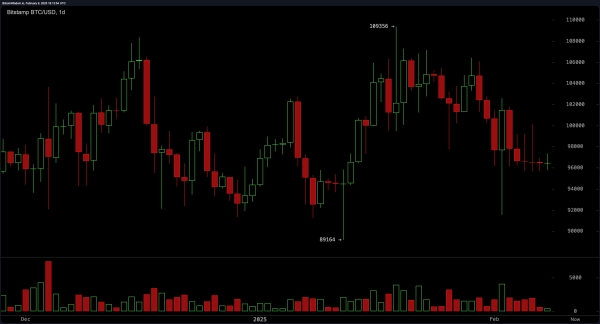 BTC/USD 1D on Feb. 9, 2025
Oscillators show mixed signals, with the relative strength index (RSI) at 42 and the Stochastic at 33, both indicating neutral conditions. The commodity channel index (CCI) at -107 suggests a buying opportunity, while momentum at -8,263 and the moving average convergence divergence (MACD) at -913 both signal selling pressure. The awesome oscillator also remains neutral at -2,613, reinforcing uncertainty in the short term.
Moving averages largely indicate bearish conditions, with the exponential moving average (EMA) and simple moving average (SMA) across 10, 20, 30, and 50 periods all generating sell signals. The 100 and 200-period moving averages provide a more optimistic outlook, with both EMAs and SMAs signaling a buy. This divergence suggests that while short-term pressure remains to the downside, longer-term support may stabilize bitcoin’s price in the coming sessions.
Bull Verdict:
Despite short-term bearish pressure, long-term support from the 100- and 200-period moving averages suggests a potential rebound. A breakout above $98,500 would likely push bitcoin toward $102,000 or higher. If bullish momentum strengthens, a retest of the $106,000–$109,000 resistance zone is possible.
Bear Verdict:
The dominance of selling pressure across key moving averages, combined with declining volume and bearish signals from the MACD and momentum indicators, suggests further downside risk. failure to hold $95,500 could trigger a drop toward $92,000, with a potential test of lower support levels near $89,000 if bearish sentiment prevails.