Bitcoin shows bullish momentum as it breaks key resistance, with price targets potentially reaching $107k this week.
Bitcoin is starting the week on a bullish note with an intraday rise of 0.70%. With the intraday rise, Bitcoin is making a bullish candle after creating four consecutive daily Doji candles.
With the recovery gaining momentum, a short-term breakout in the BTC price trend hints at a potential comeback this week. Will this recovery result in a Bitcoin price surge beyond $100,000? Let’s find out.
Bitcoin Bullish Reversal at $95k Breaks Key Resistance
In the 4-hour price chart, Bitcoin reveals a strong reversal from the $95,000 mark. The bullish comeback is strengthening as Bitcoin breaks past the local resistance trend line. Furthermore, the uptrend exceeds the 38.20% Fibonacci level.
Bitcoin Price Chart
Currently, Bitcoin is available at a market price of $97,399. With three consecutive bullish candles and significant lower price projections, Bitcoin is marking a double-bottom reversal. Furthermore, the trendline breakout marks a key bullish event for Bitcoin.
The recovery run in Bitcoin is gradually gaining strength as the TSI average lines are recovering within the negative territory. Furthermore, as the TSI lines approach the zero line in a positive alignment, the indicator supports the chances of a bullish trend.
Key Buying Opportunity
Supporting the chances of a bullish comeback, Ali Martinez has highlighted a buying opportunity in Bitcoin. In his recent X post, the analyst pointed out that the TD Sequential Indicator, perfectly timed on the Bitcoin daily chart, is now flashing a buy signal.
This hints at a potential bottom in BTC prices and increases the chances of a reversal rally.
Derivatives Market: Bullish Speculations Rise
In the derivatives market, bullish speculations have increased significantly. Bitcoin’s open interest over the past 24 hours has risen by 0.77% to $59.11 billion.
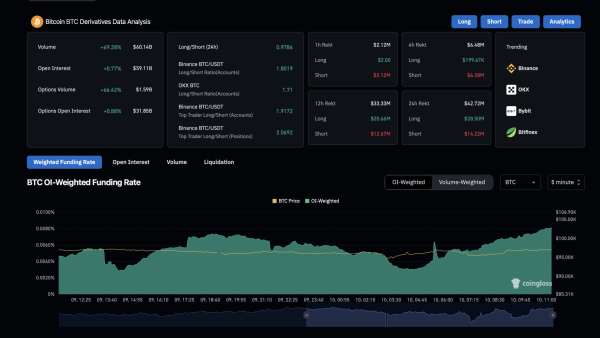 BTC Open Interest
More significantly, the funding rate has seen a notable increase. From a bottom of 0.003%, funding rates have now climbed to 0.0081%. This reflects the willingness of buyers to hold on to long positions in Bitcoin.
Additionally, Bitcoin’s long-to-short ratio has grown substantially over the past 24 hours. Currently, the Bitcoin long-to-short ratio stands at 0.9992, with long positions at 49.98% and short positions at 50.02%.
Despite the nearly equal distribution of long and short positions, the positive funding rates and increasing open interest indicate a generally bullish sentiment in the derivatives market.
BTC Price Targets Extend to $107K This Week
As the likelihood of a bullish recovery grows, Fibonacci levels indicate a key resistance at the 61.80% level, corresponding to $100,557, just above the psychological $100,000 mark. If the uptrend continues, Bitcoin could test the $107,000 supply zone this week.
On the other hand, support at the 23.6% Fibonacci level, around $94,595, is expected to hold Bitcoin’s price above this level in the event of a pullback.