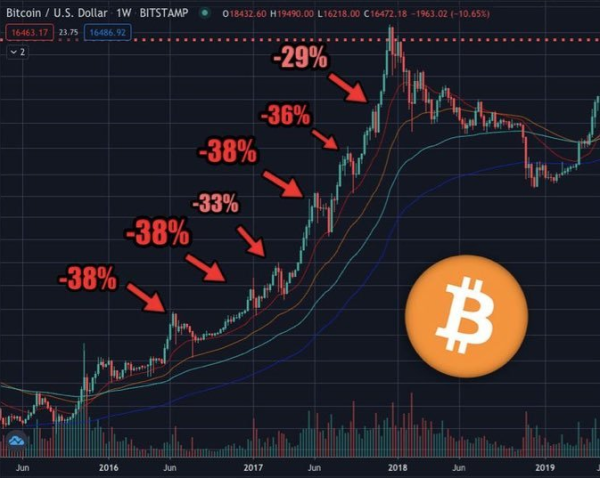
Bitcoin is trading under $90,000, marking its lowest point in a month. The cryptocurrency has fallen over 7% this week, currently hovering around $88,948. However, according to PlanB, the creator of the Bitcoin Stock-to-Flow (S2F) model, these price corrections are normal in Bitcoin’s growth cycles.
In a post on X (formerly Twitter), PlanB pointed out that back in the 2016-2017 bull market (which the current market cycle is copying), Bitcoin had several price drops of more than 30% before reaching new all-time highs. The analyst backed up his claims by posting a price chart of BTC during that time.
Blockchain intelligence firm Arkham reported that BlackRock recently moved $150 million worth of Bitcoin to Coinbase Prime. These moves are outflows from the IBIT Bitcoin ETF, which suggests institutional investors might be taking profits. These large transactions can add to selling pressure.
ALERT: BLACKROCK SELLING $BTC
BlackRock has transferred $150M BTC to Coinbase Prime. These are outflows from the IBIT Bitcoin ETF. pic.twitter.com/GoruDylqdk
— Arkham (@arkham) February 25, 2025
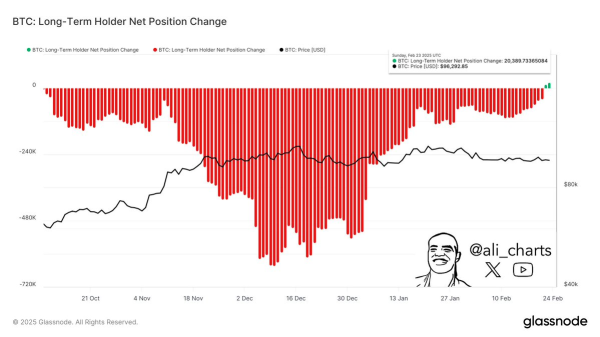
Long-Term Holders Buy the Dip, Showing Bitcoin Confidence
But, there was positive news as well. Even though there was a sharp price correction, on-chain data shows that long-term holders are buying more Bitcoin during this dip. Analyst Ali Martinez showed that long-term holders have added nearly 20,400 BTC. This signals confidence in Bitcoin’s long-term value.
Related: Negative Crypto Sentiment: Bitcoin’s Booster?
In addition, BitMEX founder Arthur Hayes shared his thoughts on the macroeconomic and political factors affecting Bitcoin’s price.
He suggests that if United States president Donald Trump fails to pass his budget and debt ceiling increases stall, we could see Bitcoin retest pre-election victory levels between $75,000 and $70,000. He advised investors to wait before putting their money in crypto.
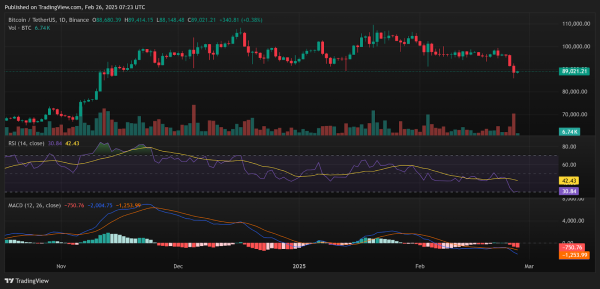
Bitcoin Price Analysis: Technical Indicators Mixed
The Relative Strength Index (RSI) for Bitcoin is at 30.84, getting close to oversold territory. A price rebound might happen soon if buyers step in, but it’s clear that market conditions are currently influenced by political events and macroeconomic conditions.
Related: Bitcoin Cracks Below $90,000: Market Tremors and Trader Losses Mount
Moving Average Convergence Divergence (MACD) indicator confirmed a bearish divergence in Bitcoin’s price action. The signal line (red) crossed above the MACD line (blue), and the MACD histogram has turned red.
Disclaimer: The information presented in this article is for informational and educational purposes only. The article does not constitute financial advice or advice of any kind. Coin Edition is not responsible for any losses incurred as a result of the utilization of content, products, or services mentioned. Readers are advised to exercise caution before taking any action related to the company.