Bitcoin’s bottom and bullish breakout is just a month away, according to analyst 
![]() Cryptocurrency Mar 5, 2025 Share
Cryptocurrency Mar 5, 2025 Share
Bitcoin’s (BTC) price action remains volatile as it swiftly recovered to $89,000 after plunging to $82,000, rebounding from a sell-off sparked by Donald Trump’s announcement of 25% tariffs on U.S. imports from Canada and Mexico.
Despite lingering bearish sentiment, the broader trend remains bullish. According to an analysis by TradingShot, Bitcoin is expected to consolidate sideways throughout March, attempting to establish a firm bottom before making a decisive move. Historical price trends suggest that a potential breakout could unfold within a month.
“As a result and based on all the above conditions, it is possible to see Bitcoin consolidate sideways in an attempt to cement the bottom for the majority of March. A break above the 1D MA50 either then or earlier, would be a technical bullish break-out confirmation.”
Picks for you
Robert Kiyosaki blasts Bitcoin sellers after market crash 29 mins ago Analyst says XRP 'is ready for an all-time high' if it holds above key levels 46 mins ago If you invested $1,000 in Bitcoin when Trump took office, you’d now have this much 1 hour ago 4 billion XRP tokens released by Ripple in a year 2 hours ago
Technical analysis: Bitcoin faces resistance at 1D MA50
Bitcoin’s latest rebound highlights buying activity at critical support levels, though it continues to face resistance at the 50-day moving average (1D MA50) near $99,000, which has rejected multiple breakout attempts throughout February.
 Bitcoin price analysis chart. Source: TradingShot/TradingView
Historical trends indicate that Bitcoin could remain range-bound for another month before making a decisive move, much like the August 2023 pattern, where Bitcoin took nearly four weeks to break past resistance following an oversold Relative Strength Index (RSI).
A break above the 1D MA50 would be a strong bullish confirmation, signaling the start of a rally. If BTC follows previous market cycles, such a breakout could push its price toward $160,000.
Bitcoin’s market structure signals a pullback phase
While technical indicators suggest Bitcoin is in a bottoming phase, on-chain data provides further insight into shifting market dynamics.
According to CryptoQuant analysts, as Bitcoin reached its all-time high (ATH), market data showed a shift in supply dynamics, with short-term holders (STH) increasing their holdings while long-term holders (LTH) gradually selling their holdings.
Historically, a decline in LTH supply has coincided with market tops, as long-term investors take profits while STH absorbs selling pressure, leading to overheated market conditions.
CryptoQuant’s analysis noted that Bitcoin is in a pullback phase following its ATH, with the market likely to continue consolidating due to liquidity constraints. Short-term rallies may face resistance until BTC establishes a new accumulation phase.
This transition would signal that long positions are becoming viable once more. Until LTH accumulation resumes, analysts caution that Bitcoin may face continued resistance, delaying a breakout.
Bitcoin price analysis
At press time, Bitcoin is trading at $89,661, posting a 6% gain in the past 24 hours and a modest 1% increase on the weekly chart.
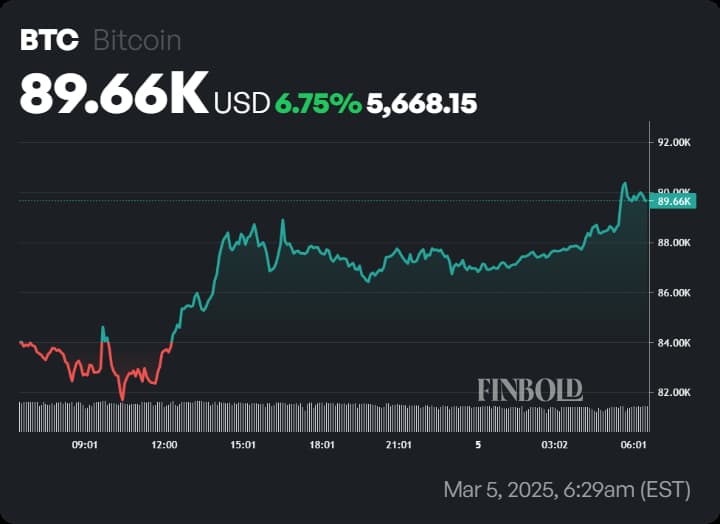 BTC one-day price chart. Source: Finbold
That being said, Bitcoin’s recent rebound indicates strong buying interest at lower levels, but its ability to break through the key resistance at $99,000 remains the critical factor in determining the next phase of its trend.
Featured image via Shutterstock