Bitcoin is currently trading at $104,514, supported by a market capitalization of $2.07 trillion and a 24-hour trading volume of $26.48 billion. Its intraday price has fluctuated within a tight band between $103,133 and $104,841, signaling a period of short-term consolidation following a recent bullish rally.
Bitcoin
The hourly chart reveals that bitcoin has entered a choppy sideways range after peaking at $104,985. A sharp rejection from this level was followed by a bounce off the $103,000 support line, indicating active short-term demand. Despite this, the declining volume on red candles after the breakout suggests a weakening bullish momentum. Entry points appear viable on a confirmed breakout above $104,800, while a breach below $103,000 amid rising sell volume would be a strong exit signal. Traders should be cautious, as volume divergence is present, a notable bearish indicator.
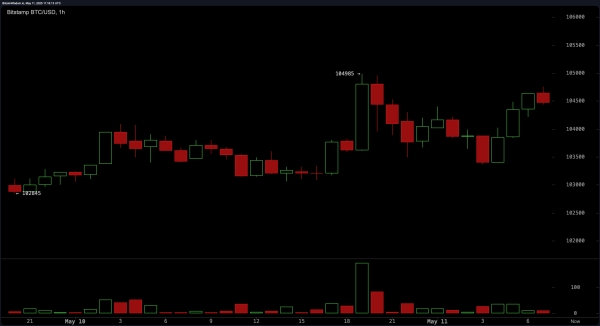 BTC/USD 1H chart via Bitstamp on May 11, 2025.
Zooming into the four-hour chart, bitcoin exhibits a plateau pattern after an aggressive upward movement. A noticeable volume spike at the peak near $104,985 was followed by a tapering in trade activity, which suggests distribution rather than accumulation. Lower highs have been forming since the peak, hinting at emerging short-term bearish sentiment. The $102,500 area is worth watching for a potential bounce, especially if supported by increased volume. Reclaiming $104,500 with strong follow-through would be required to reestablish a bullish stance.
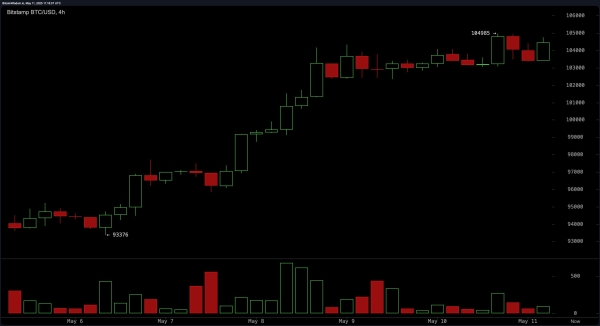 BTC/USD 4H chart via Bitstamp on May 11, 2025.
On the daily chart, bitcoin maintains a strong uptrend characterized by higher highs and higher lows. Support is established near the $95,000 range, which acted as a prior consolidation zone, while resistance is currently positioned around $104,985. However, volume has been declining on recent green candles, pointing to possible buying fatigue. A strategic entry may present itself in the $98,000 to $100,000 range if reversal confirmation emerges, such as a long wick or bullish engulfing candlestick. If volume continues to trail, any test near the $105,000 mark could fail to hold.
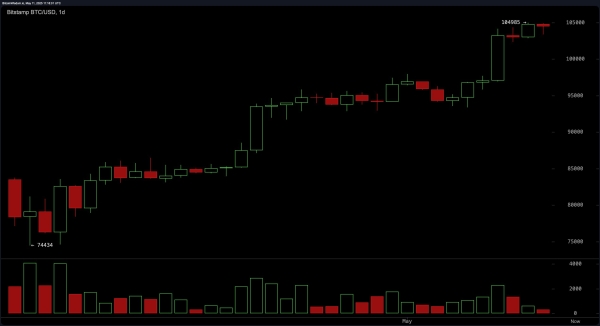 BTC/USD 1D chart via Bitstamp on May 11, 2025.
Oscillator readings offer a mixed technical sentiment. The relative strength index (RSI) stands at 75 and the commodity channel index (CCI) at 184, both issuing sell signals due to overbought conditions. Momentum is similarly bearish with a value of 7,919. However, the moving average convergence divergence (MACD) provides a positive signal with a positive divergence of 4,110. Meanwhile, the Stochastic oscillator at 94, the average directional index (ADX) at 36, and the awesome oscillator all show neutral stances, reflecting market indecision.
From a moving averages perspective, bitcoin remains firmly bullish across all timeframes. The 10-, 20-, 30-, 50-, 100-, and 200-period exponential moving averages (EMA) and simple moving averages (SMA) all indicate bullish signals, underscoring long-term upward strength. These averages suggest strong underlying trend support, even amid short-term pullbacks. However, given the current divergence between price action and volume, traders are advised to prioritize confirmation signals before entering new positions. Chasing prices near all-time highs without volume support exposes traders to potential downside volatility.
Bull Verdict:
Bitcoin remains structurally strong with consistent buy signals across all key moving averages, supported by a robust uptrend on the daily chart. If the price breaks above $104,800 with confirmed volume, the bullish continuation toward new highs remains intact.
Bear Verdict:
Overbought oscillator conditions and declining volume amid rising prices suggest potential exhaustion. A failure to hold the $103,000 support could trigger a deeper retracement toward the $98,000–$100,000 range.