Here’s Bitcoin’s next target as BTC completes bullish cross 
![]() Cryptocurrency May 26, 2025 Share
Cryptocurrency May 26, 2025 Share
Bitcoin (BTC) has rebounded over the past 24 hours, nearing the $110,000 mark, and a trading expert’s analysis suggests the asset may be targeting new highs based on its technical setup.
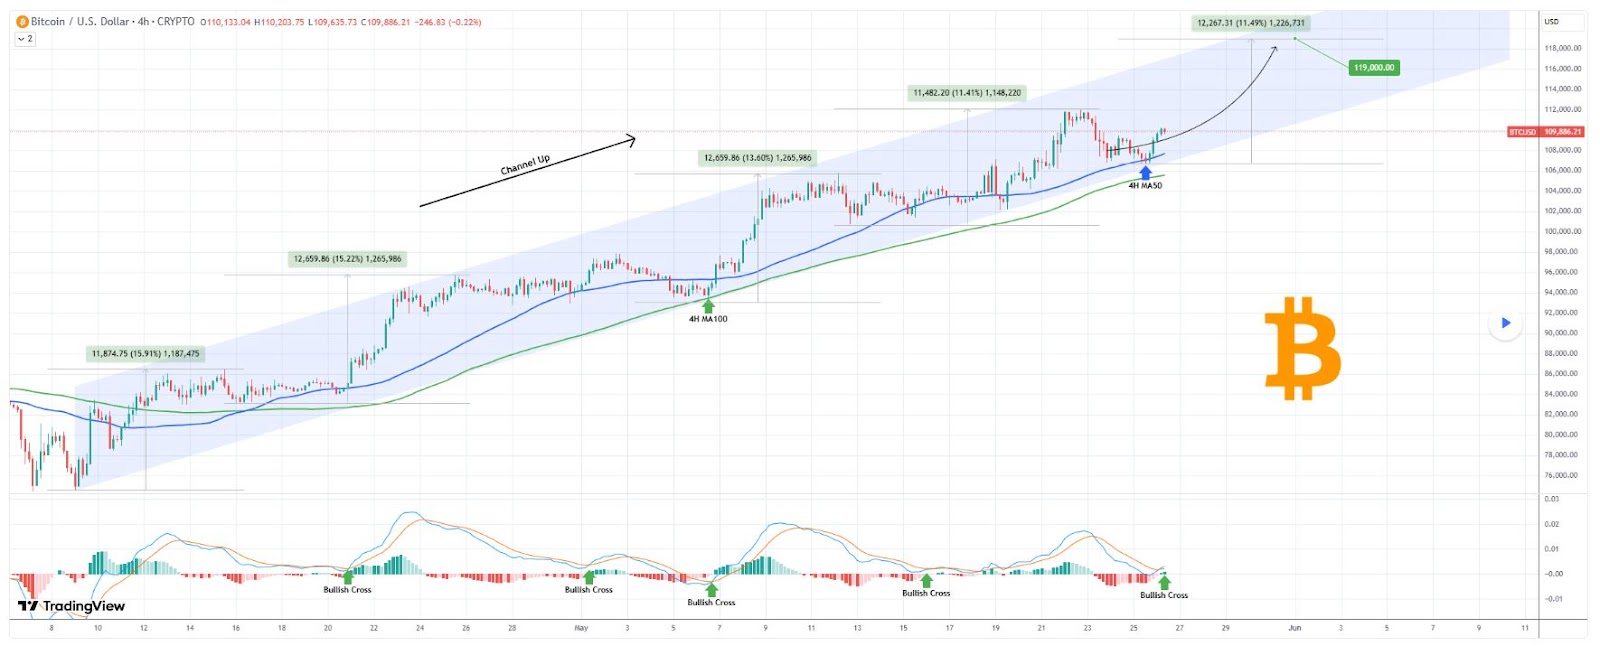
According to a May 25 TradingView post by prominent analyst TradingShot, BTC has been steadily climbing within a well-defined six-week channel up formation, signaling possible growth.
Despite a brief pullback triggered by tariff-related macroeconomic concerns, the cryptocurrency has bounced back, potentially setting the stage for another bullish leg.
 Bitcoin price analysis. Source: TradingView
The recent retracement found support at the four-hour 50-period moving average (MA) and stayed within the channel. The four-hour 100-period MA also remained intact as a key support level, which TradingShot views as crucial for maintaining the uptrend.
Bitcoin’s next high target
A notable technical signal is the recent bullish MACD cross on the four-hour chart, a historically reliable buy indicator in this trend. Previous MACD crosses within this channel have preceded gains of 11.41% to 15.91%; each marking renewed buying momentum.
Using the lowest historical return as a benchmark, an 11.41% increase from current levels would put Bitcoin’s next target around $119,000. This aligns with the channel’s upper boundary and supports TradingShot’s broader forecast that BTC could reach $200,000 between October and December 2025.
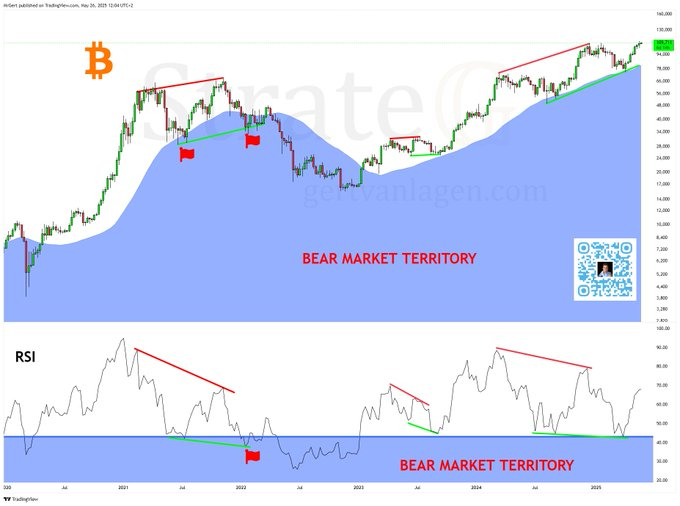
Separately, analyst Gert van Lagen noted in a May 26 X post that Bitcoin’s weekly chart shows continued strength, well above bear market territory.
 Bitcoin price analysis. Source: TradingView
Historically, this timeframe often sees a bearish divergence, with the price making higher highs. In comparison, the RSI makes lower highs. This is followed by a hidden bullish divergence, with higher lows in price and lower lows in the relative strength index (RSI).
Lagen pointed to 2022 as a rare exception when hidden bullish divergence failed due to price and RSI slipping into bear market territory. That’s not the case now: current price action remains strong, and RSI is comfortably above warning levels.
Bitcoin price analysis
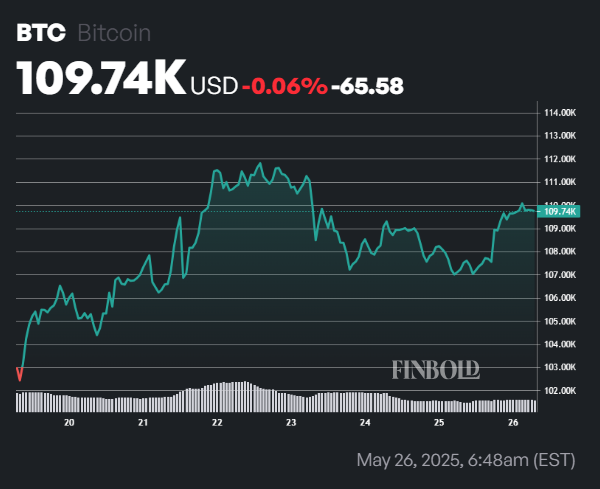
As of press time, Bitcoin was trading at $109,735, up 2.3% in the past 24 hours and 1.4% over the past week.
 Bitcoin seven-day price chart. Source: Finbold
Bitcoin’s technical setup suggests further upside. The 50-day and 200-day simple moving averages (SMAs) are significantly lower, at $95,244 and $86,640, respectively, indicating strong upward momentum.
However, a short-term pullback or consolidation may be likely, as the 14-day RSI is nearing overbought territory at 65.
Featured image via Shutterstock