AI predicts Bitcoin price for Halloween 2024 
![]() Cryptocurrency Oct 17, 2024 Share
Cryptocurrency Oct 17, 2024 Share
In recent years, Bitcoin’s (BTC) price has mostly appreciated each Halloween season, and now an artificial intelligence (AI)-enabled analysis tool, alongside chart patterns, is highlighting a possible continuation of this trend in 2024.
Except for 2018 and 2022, the valuation of the maiden cryptocurrency has traded higher on each Halloween day than the year before.
Therefore, to determine if the trend will be replicated in 2024, Finbold leveraged insights from advanced AI algorithms deployed by the crypto analytics and forecasting platform PricePredictions.
Picks for you
Perplexity AI predicts Gold price based on analysts’ insights 15 hours ago Expert warns Bitcoin is in a 'bull trap,' sets next BTC price low target 16 hours ago Trader highlights key levels to build positions for the 'upcoming bull run' 17 hours ago Bitcoin price eyes $88,000 by year-end with incoming breakout 19 hours ago
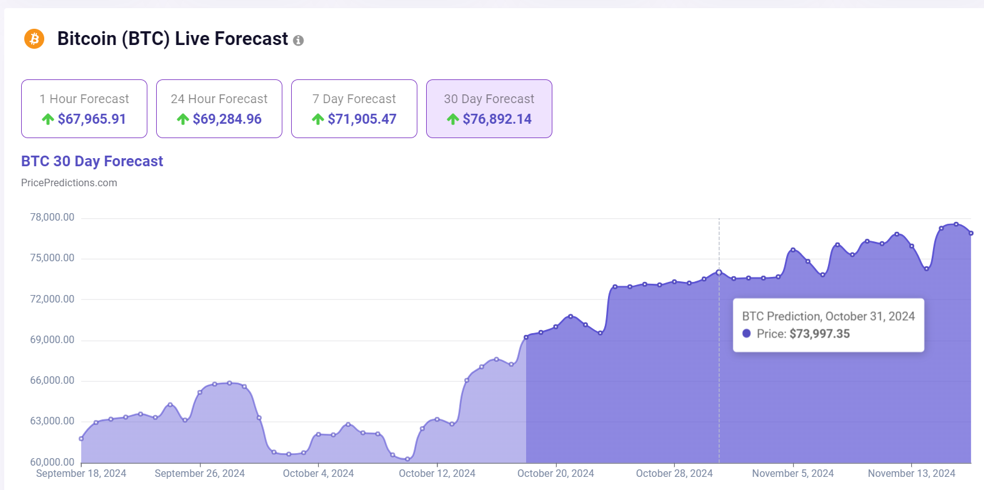
According to the tool, Bitcoin will likely trade at a new record high of $73,977 on October 31, the date of Halloween 2024. This price target reflects an increase of almost 10% from the asset’s valuation as of press time.
 Bitcoin price prediction for October 31. Source: PricePredictions.com
The AI tool deploys metrics such as technical analysis (TA) indicators, such as moving average convergence divergence (MACD), relative strength index (RSI), and Bollinger Bands (BB), to generate the price projection.
Bitcoin’s past Halloween performance
Indeed, if the price projection were to be realized, Bitcoin would follow the recent trend of trading higher on Halloween than in previous years. In this case, the forecasted 2024 Bitcoin Halloween price is an increase of almost 115% from the $34,500 value recorded in 2023.
This bullish outlook is backed by most finance experts who foresee Bitcoin clinching $70,000 as the lowest target for the end of October. This outlook is supported by the possible realization of the ‘Uptober’ rally, where the leading cryptocurrency tends to surge in value in October.
In this regard, Stephen Maitland, the owner and investment research manager at Gold IRA Investment Guy, believes the digital asset will likely see a high of $85,000 at the end of October 2024.
As a reminder, Bitcoin has recovered after starting October on a weaker note. Notably, BTC was hampered by volatility, dropping below the $60,000 support zone at some point in reaction to the hotter-than-expected CPI data.
With renewed optimistic momentum that has established the price above the $65,000 support zone, the rally is anticipated to extend further.
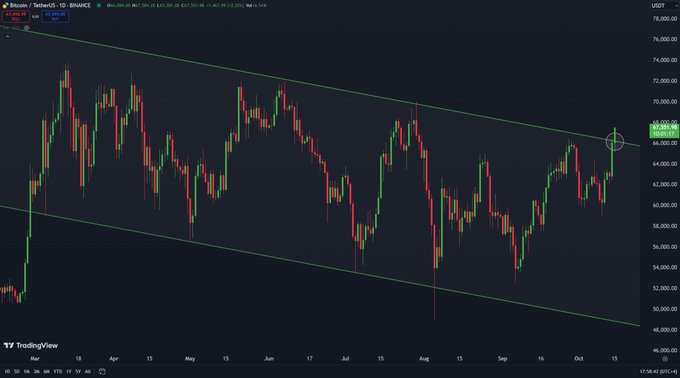
For instance, a crypto analyst with the pseudonym The Moon, in an X post on October 15, stated that if Bitcoin can firmly establish its price above $67,000, the spot could anchor a rally toward $100,000.
 Bitcoin price analysis chart. Source: TradingView
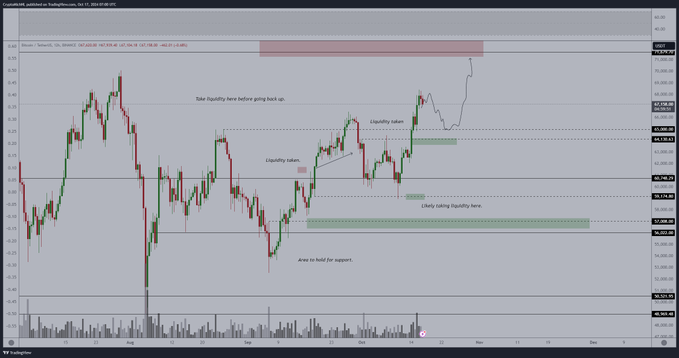
On the other hand, crypto trading expert Michaël van de Poppe reiterated his bullish outlook for Bitcoin despite expecting a brief correction in the short term. In an analysis shared on October 17, the current structure suggests that Bitcoin might temporarily decline to key liquidity areas, around $60,000, before resuming its upward trajectory.
Poppe believes that Bitcoin will likely continue its bullish momentum once the correction phase is complete, potentially reaching new record highs by next week.
 Bitcoin price analysis chart. Source: TradingView
Meanwhile, as reported by Finbold, another analyst, Alan Santana, opined that the current Bitcoin momentum can be considered a ‘bull trap’ warning that technical indicators and historical price movement suggest the asset is destined for losses, possibly below the $40,000 mark.
Bitcoin price analysis
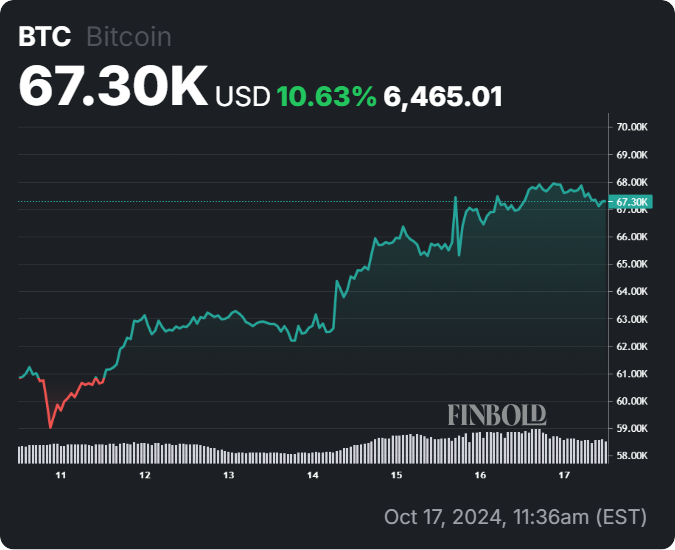
By press time, Bitcoin had made modest daily gains of about 0.5%, valued at $67,439. In the past week, the asset has rallied over 10%.
 Bitcoin seven-day price chart. Source: Finbold
As things stand, Bitcoin is showing chances of continued bullish momentum both in the long and short term, considering that its price is well established above its 50-day and 200-day simple moving averages.
However, with a 14-day RSI of 67.46, it’s approaching overbought territory, suggesting a potential pullback or consolidation may occur if buying pressure weakens.