Volatility strikes down: $478M whipped from crypto traders in liquidations 
![]() Cryptocurrency Nov 23, 2024 Share
Cryptocurrency Nov 23, 2024 Share
Crypto’s volatility strikes again this Saturday, November 23, liquidating over $478 million worth of traders’ positions amid ups and downs. XRP and ADA, for example, registered massive gains but also sharp corrections.
As Bitcoin (BTC) consolidates below the $100,000 psychological resistance, an altseason is starting, bringing significant volatility with big moves. Altcoins have seen double-digit gains, liquidating bearish short-sellers, just to see double-digit corrections right after, liquidating bullish long-position traders.
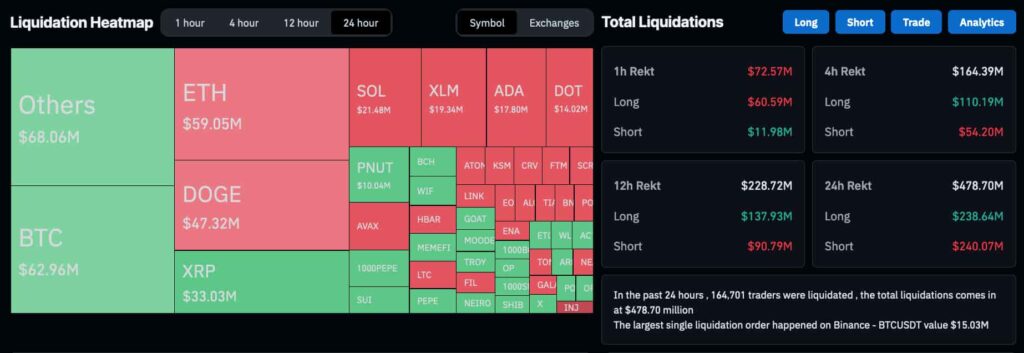
Notably, the 24-hour crypto liquidations total $478 million, equally punishing both sides of the market. According to data Finbold retrieved from CoinGlass, the volatility liquidated $240 million and $238 million from shorts and longs, respectively.
Picks for you
We asked ChatGPT-4o what’s next for Solana as SOL hits new highs 3 hours ago Caution: United States recession probability sharply rises in 2024 4 hours ago This indicator is a clear sign of Bitcoin surging past $100,000 6 hours ago New crypto opportunity for investors who missed XRP and ADA price rally 7 hours ago
The largest single liquidation affected a BTC/USDT trader on Binance, striking down a $15.03 million position. Today’s liquidations affected over 164,700 crypto traders, with low-cap altcoins getting the spotlight, totaling over $68 million.
 Liquidation Heatmap and Total Liquidations – 24 hours. Source: CoinGlass / Finbold
Crypto volatility causes trader’s liquidations
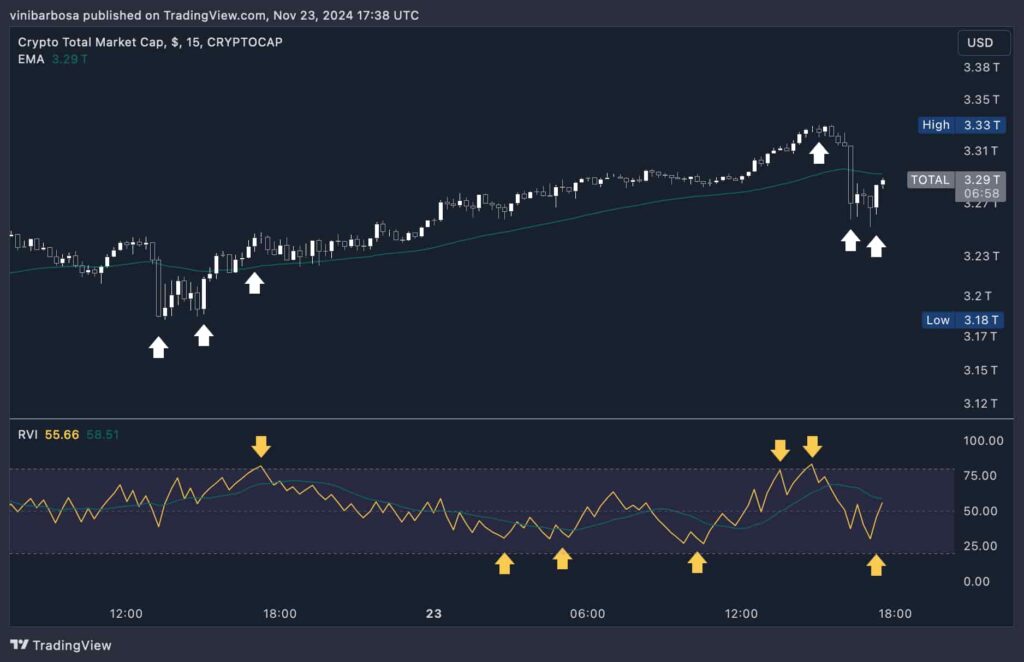
Overall, the higher the volatility in the market, the more likely crypto traders will face liquidations, as seen today. Illustrating that, we looked at TradingView’s Crypto Total Market Cap Index (TOTAL) 15-minute chart and the Relative Volatility Index (RVI).
In particular, TOTAL went from a $3.18 trillion cap to a peak at $3.33 trillion in 24 hours. The RVI touched 75 points three times while nearing 25 points more than four times, showing high volatility.
 Crypto Total Market Cap Index (TOTAL), 15-minute chart. Source: TradingView / Finbold / Vinicius Barbosa
Essentially, a non-volatile market would hover around 50 RVI points, with each extreme meaning increased volatility – up or down.
Each time the index sharply moves in one direction, it is because the market experienced some significant price action. Each time the price moves aggressively, edging positions suffer liquidation, erasing the trader’s crypto collateral.
Interestingly, Bitcoin also suffered from volatility and liquidation, especially after the controversial Jim Cramer recommended a “buy” for BTC. Now, traders and investors cautiously await the next move and indicators of the next entry and exit points.
Featured image from Shutterstock.