Bitcoin set for $125,000 if this level is breached, according to analyst 
![]() Cryptocurrency Aug 12, 2024 Share
Cryptocurrency Aug 12, 2024 Share
Bitcoin (BTC) is aiming to reclaim the psychological level of $60,000 amid a short-term correction, with analysis suggesting that technical indicators point to the cryptocurrency being poised for a new record high.
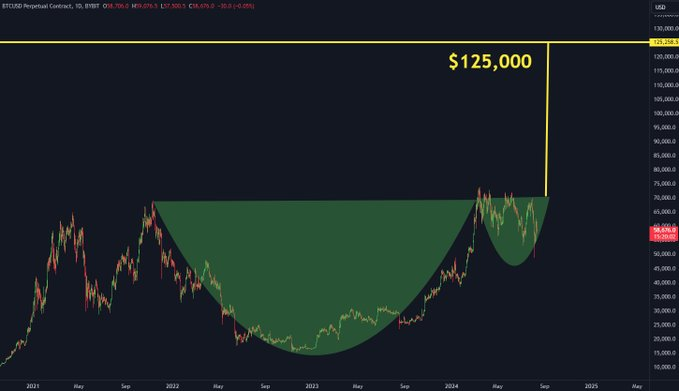
In particular, in an X post on August 12, the analyst by the pseudonym TheMoonCarl stated that Bitcoin is facing key resistance, which, if breached, could lead to the cryptocurrency reaching $125,000.
The prediction is based on forming a “cup and handle” pattern. TheMoonCarl showcased Bitcoin’s price movement from 2021 to the present day, highlighting the formation of the cup portion, which began after the asset’s decline in late 2021.
Picks for you
XRP signals strong bullish momentum targeting $60, according to analyst 35 mins ago AI predicts Gold price following CPI data release 3 hours ago Final Zeus Network testnet launches with 15,000 wallets in the first 72 hours 4 hours ago Crypto expert Michaël van de Poppe updates altcoin portfolio 5 hours ago  Bitcoin price analysis chart. Source: The Moon
The cup portion of the pattern represents a period of consolidation and recovery, where Bitcoin’s price gradually formed a rounded bottom, signifying a strong support level.
Following the cup, the handle forms a brief period of consolidation or slight retracement, which Bitcoin appears to be undergoing. The analyst noted that if Bitcoin successfully breaks out of this handle formation, around the $70,000 level, the next price target could be as high as $125,000, a figure derived from adding the height of the cup to the breakout point.
Bitcoin set for further gains
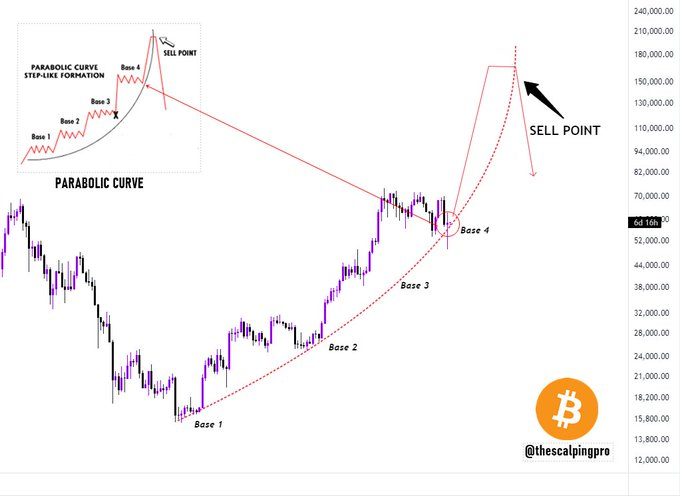
Meanwhile, another analyst, TheScalpingPro, in an X post on August 12, also suggested that despite recent Bitcoin volatility, the cryptocurrency is still poised for a bullish rally in the long term. The expert noted that Bitcoin is forming a classic parabolic curve, often associated with strong bullish momentum.
 Bitcoin price analysis chart. Source: TheScalpingPro
The curve suggests that Bitcoin could see accelerated gains through each base, with a potential peak target of around $180,000. However, the analysis also indicated a possible “sell point” near the top of the curve, where a sharp correction could follow the parabolic rise.
It’s worth noting that Bitcoin has made a swift recovery after briefly dropping below $49,000 amid US recession fears. The cryptocurrency rebounded, reaching a high of $62,500 on the weekly chart.
The current Bitcoin slump has been partially attributed to what is perceived as a lack of interest from institutions in purchasing stablecoins. In an August 12 post, the on-chain analytics platform Lookonchain noted that institutions may have stopped buying USDT two days ago.
Institutions seem to have temporarily stopped buying, and the price of $BTC dropped 4.5% today!
We noticed that institutions stopped receiving $USDT from #TetherTreasury and transferring it to exchanges 2 days ago.https://t.co/0XKiPmjJed pic.twitter.com/NRFkp4Vqan
— Lookonchain (@lookonchain) August 12, 2024
This suggests a lack of buying pressure and reduced investor appetite for stablecoins, commonly used as the primary on-ramp from fiat currency to the crypto market.
Bitcoin price analysis
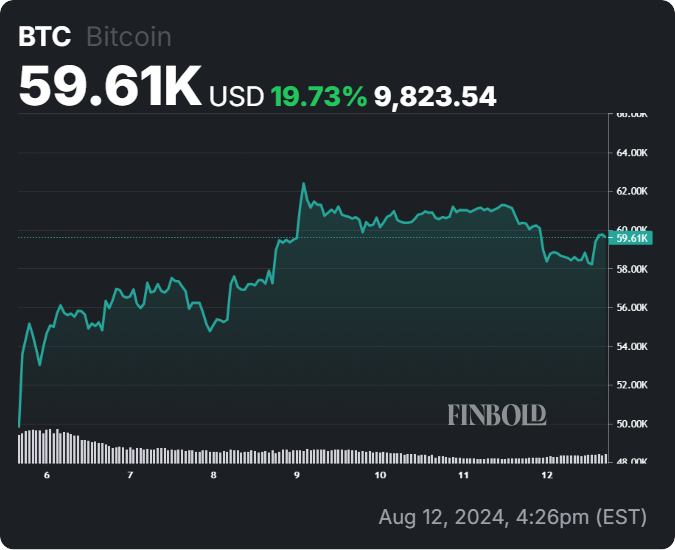
At press time, Bitcoin was trading at $58,976, with 24-hour losses of over 2%. On the weekly chart, BTC remains in the green with gains of nearly 20%.
 Bitcoin seven-day price chart. Source: Finbold
If Bitcoin reclaims the $60,000 resistance, it will be a crucial anchor toward reaching $70,000, a level considered central to achieving a new all-time high.
Disclaimer: The content on this site should not be considered investment advice. Investing is speculative. When investing, your capital is at risk.