Bitcoin adds $120 billion in a day as BTC zooms toward $100k 
![]() Cryptocurrency Apr 23, 2025 Share
Cryptocurrency Apr 23, 2025 Share
Summary
⚈ Bitcoin gained $120 billion in one day, nearing the $100k mark.
⚈ Rally momentum suggests BTC could reach $200k by year-end.
⚈ Bitcoin is trading like gold, diverging from falling stock markets.
Over the last two weeks, Bitcoin (BTC) has broken its alignment with stocks and has been trading more like gold. Specifically, the world’s premier cryptocurrency entered a rally late on April 8 after falling to lows near $75,000 and accelerated the upsurge on April 20.
The most recent trading has, by far, been the most dramatic, as BTC added $120 billion to its market capitalization in a day, with its valuation soaring from approximately $1.75 trillion to $1.87 trillion. Even the latest downward correction did little to diminish the gains as Bitcoin’s market cap remains roughly $100 billion up in the last 24 hours, per the data Finbold retrieved from CoinMarketCap.
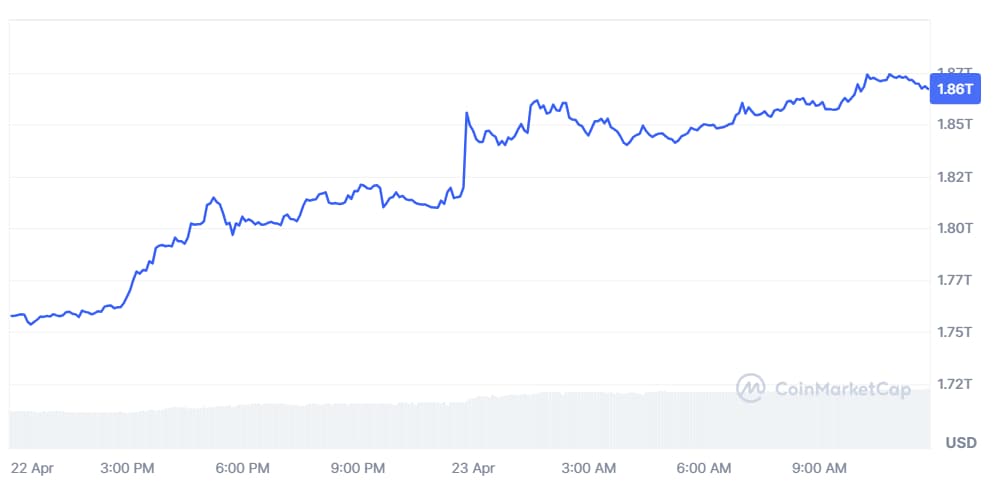 Bitcoin 24-hour market capitalization chart. Source: CoinMarketCap
Furthermore, the pace of the rally that started on April 20 is evident in the weekly valuation chart, which shows that within less than three days, BTC added around $200 billion.
Is Bitcoin aiming for $100,000?
Elsewhere, the positive momentum promises to take Bitcoin back toward its highs above $100,000. If it crosses the psychologically important threshold, sentiment could turn positive enough to send the cryptocurrency toward the previously forecasted highs, near or even above $200,000, before the end of 2025.
Still, the aforementioned correction, which kicked in just after BTC reclaimed $95,000, demonstrates that the coin cannot expect entirely smooth sailing as it moves higher. Nonetheless, the surge finally pushed Bitcoin back into the green in the year-to-date (YTD) chart, albeit by only 0.42%. It is trading at $93,909 at press time.
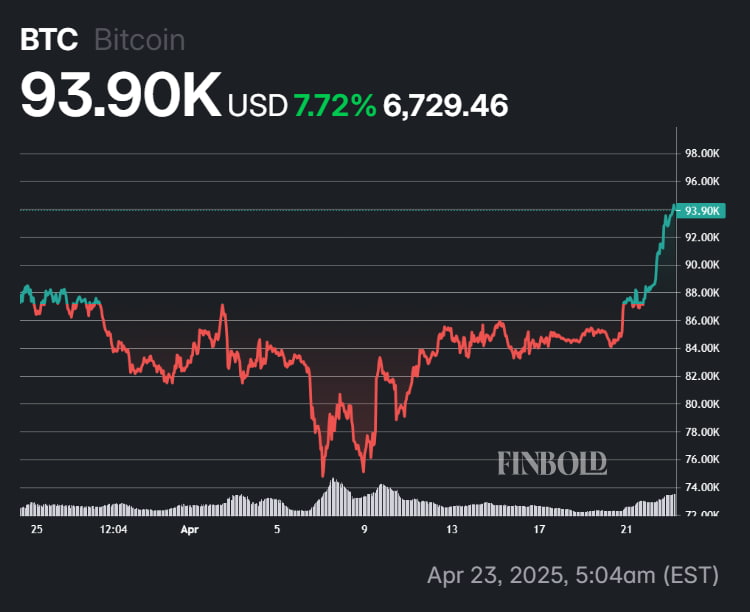 BTC 30-day price chart. Source: Finbold
The return of digital gold?
Such performance is exceptionally interesting as, once again, it signals BTC breaking its alignment with stocks and taking after gold. Within the last 30 days, the benchmark S&P 500 index has decreased by 8.32% to 5,287 points.
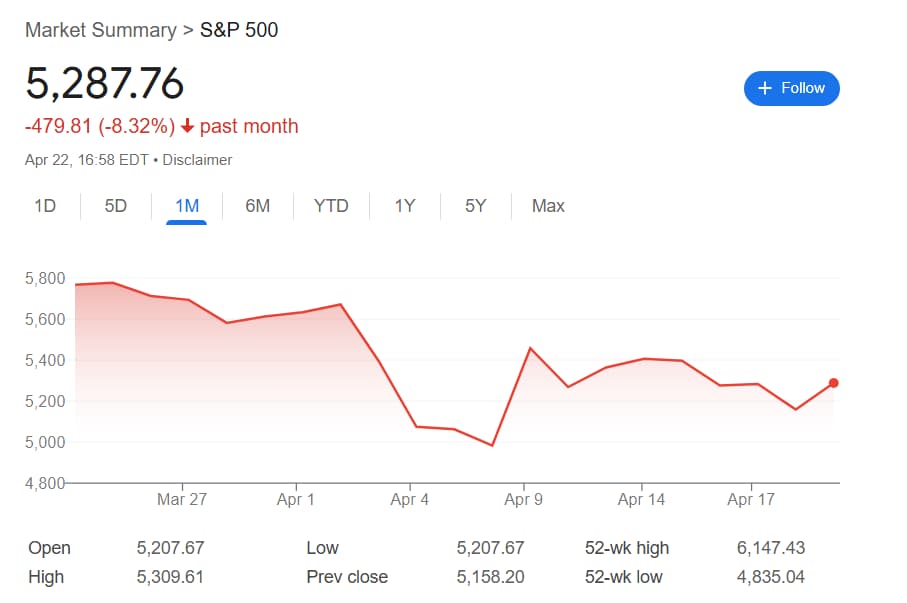 S&P 500 30-day price chart. Source: Google
Simultaneously, gold has only accelerated its rise after crossing above $3,000 for the first time in history in mid-March. The commodity took approximately 22 months to increase from $2,000 to $3,000, while it soared by $500 to reach a new high above $3,500 within just over 30 days.
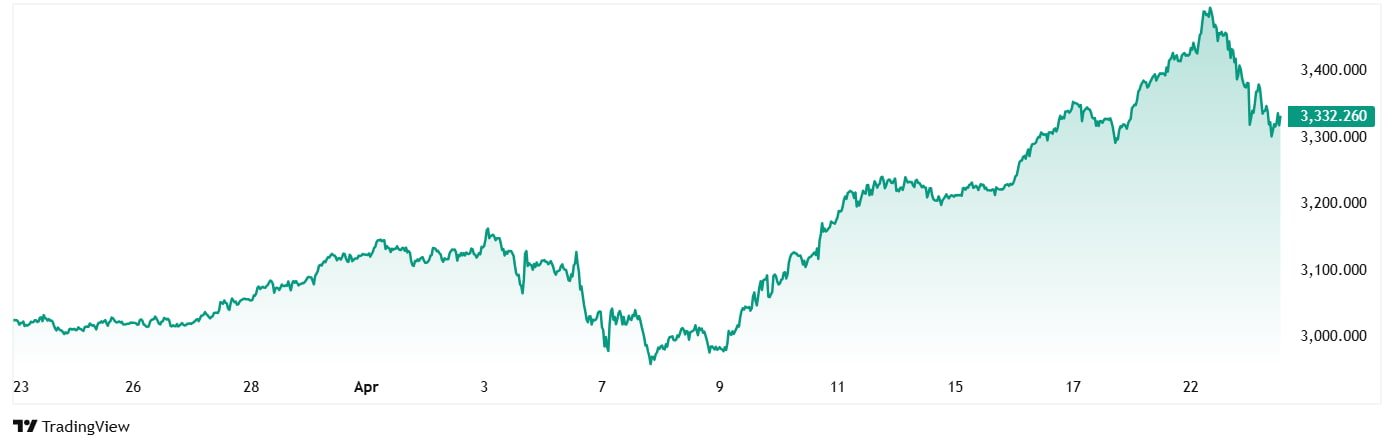 Gold 30-day price chart. Source: TradingView
Similar to Bitcoin, gold corrected soon after crossing above $3,500 and, at press time on April 23, was changing hands at $3,332.
Featured image via Shutterstock