Bitcoin analyst predicts BTC will hit this price as bullish pattern unfolds 
![]() Cryptocurrency Feb 5, 2025 Share
Cryptocurrency Feb 5, 2025 Share
Bitcoin (BTC) and altcoins have been caught in sharp market swings following a steep crash earlier this week, driven by President Donald Trump’s tariff order.
BTC briefly reclaimed $100,000, but the momentum quickly faded, pulling the price back to $98,000. Despite the setback, analysts see a bullish pattern forming, hinting at a potential breakout ahead.
Technical pattern signals a potential surge
In an analysis by Trader Tardigrade, Bitcoin’s price action has formed a bullish pennant on the two-day chart, suggesting a continuation of the strong uptrend.
Picks for you
It's getting 'exciting' as this XRP structure sets next target at $8 1 hour ago World Mobile teams up with DITO CME to promote blockchain connectivity in Philippines 4 hours ago AI predicts Shiba Inu (SHIB) price for February 28, 2025 5 hours ago $9 trillion of US debt will mature in 2025; Should investors be worried? 22 hours ago
This technical formation, characterized by a consolidation phase following a sharp price rally, is often a precursor to another leg up.
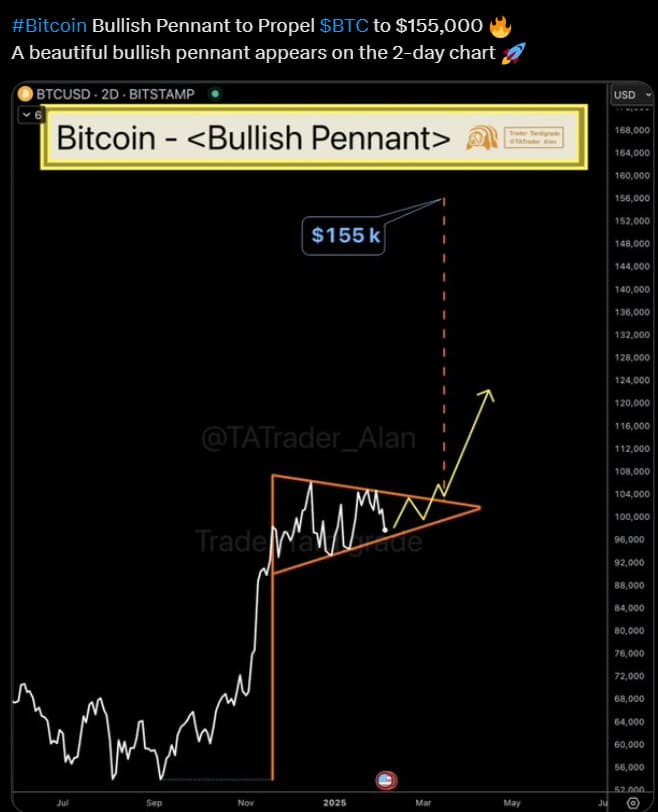 BTC price analysis chat. Source: Trader Tardigrade/ X
The analyst projected that if BTC confirms a breakout from this formation, it could surge toward $155,000 in the coming months.
BTC price key levels to watch
According to the analysis, Bitcoin is facing stiff resistance at $104,000, a level that has halted previous rally attempts. A breakout could pave the way for the psychological levels of $110,000 and $120,000, with the pennant pattern signaling a potential surge to $155,000.
On the downside, the $94,000 to $96,000 zone remains a key support, losing this level could invalidate the bullish setup and trigger a deeper correction.
More bullish projections for BTC
Beyond the bullish pennant, Bitcoin’s long-term Channel Up pattern continues to support the uptrend.
Notably, TradingShot points to a fractally similar setup between previous rallies and the current price action, with BTC’s recent bounce off the 100-day moving average echoing its January 23, 2024 rebound.
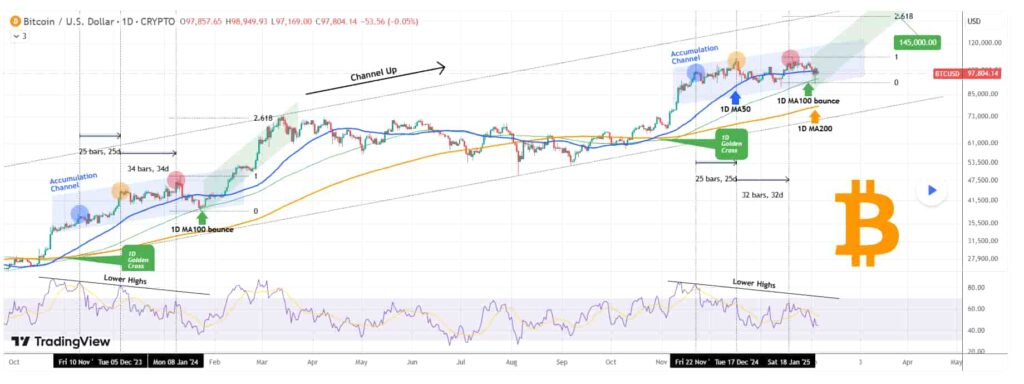 Bitcoin price analysis chart. Source: TradingShot/TradingView
Technical indicators add further weight to the bullish case, pointing to RSI-based symmetry between previous and current accumulation phases.
The time between key RSI lower highs in previous accumulation phases was 25 and 34 days, nearly mirroring the 25 and 32-day intervals observed in the current cycle. If this fractal pattern plays out, Bitcoin could be on the verge of another parabolic rally, with $145,000 as a key upside target.
While price projections vary, the overall outlook points to a strong rebound in the near term, potentially setting the stage for BTC’s next major breakout.
Bitcoin price analysis
At press time, BTC was trading at $98,253, down 1.6% on the day and 3% on the week, as market volatility persists amid trade war fears.
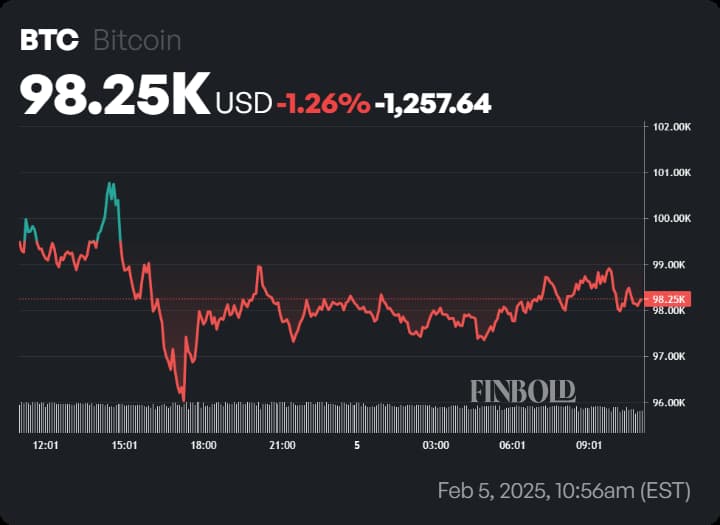 Bitcoin one-day price chart. Source: Finbold
As market participants track upcoming macroeconomic indicators and geopolitical developments, Bitcoin’s price action remains closely tied to broader economic trends, with the next major move likely dictated by shifts in global sentiment.
Featured image via Shutterstock