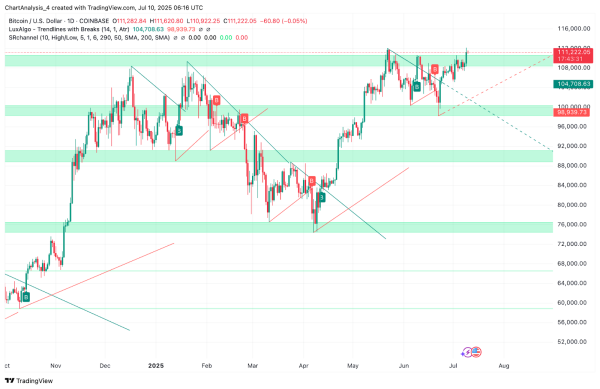
After climbing over 3% in the past 48 hours, Bitcoin price is testing the upper range of its recent consolidation near $111,300. However, as the price nears the upper Bollinger Band and horizontal resistance at $112,400, early signs of exhaustion are surfacing. The question now is whether Bitcoin price today can secure a breakout above this resistance or if bulls will step back and allow a short-term correction.
What’s Happening With Bitcoin’s Price?
 BTC price dynamics (Source: TradingView)
Bitcoin has surged out of a two-week ascending triangle, supported by a strong trendline from late June. The breakout above $110,000 was accompanied by a volume spike, pushing price into the $111,300–$111,600 region.
 BTC price dynamics (Source: TradingView)
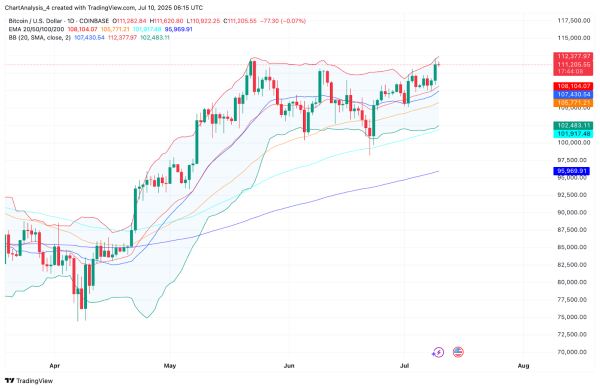
On the daily chart, BTC is approaching the upper Bollinger Band at $112,377, with price currently facing rejection near this line.
The EMA cluster (20/50/100/200) is fully stacked beneath price and showing healthy bullish alignment. The nearest dynamic support now lies at the EMA20 near $108,100, with further support from the EMA50 at $105,770.
 BTC price dynamics (Source: TradingView)
Key horizontal supply zones from earlier in May and June converge around $112,400, which has now flipped into a decisive resistance barrier. Without a strong close above this level, the rally may stall.
Why Is The Bitcoin Price Going Up Today?
 BTC Derivative Analysis (Source: Coinglass)
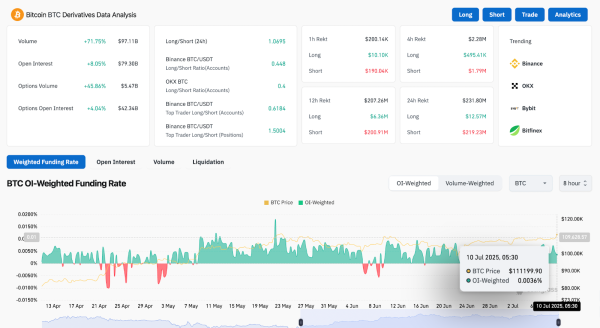
The reason behind why Bitcoin price going up today is largely driven by strong derivatives inflows and technical breakout momentum. According to the latest data:
- Derivatives volume surged 71.75% to $97.11B
- Open interest jumped by 8.05%, reaching $79.3B
- Funding rates remain positive at 0.0036%, reflecting long-biased sentiment
- Binance top trader long/short ratio hit 1.5, indicating aggressive long positioning
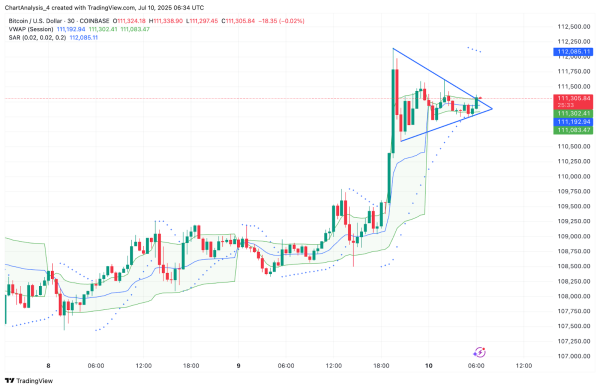
The 30-minute chart shows a symmetrical triangle breakout near $111,200, with VWAP currently holding just below the price at $111,192. Parabolic SAR dots have flipped below price, adding to the bullish confirmation.
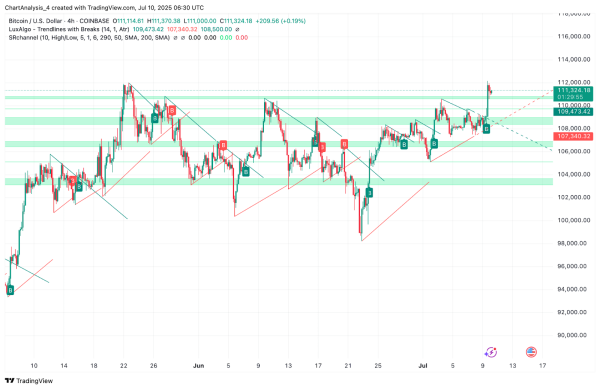
However, caution is warranted. On the 4-hour chart, price has touched the upper channel resistance of a rising wedge while indicators like RSI begin to flatten. Immediate resistance lies at $112,226 (pivot R4) and $112,500, where confluence zones may trigger profit-taking.
Supertrend, DMI, and Bollinger Bands Signal Short-Term Tug of War
 BTC price dynamics (Source: TradingView)
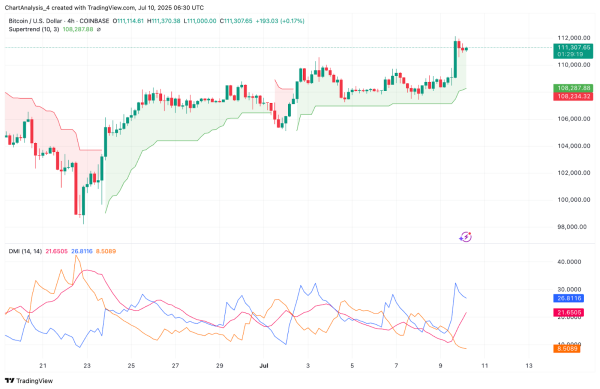
The Supertrend indicator on the 4H chart remains bullish with support at $108,287, confirming the breakout structure. This support also aligns with the previous range top near $108,000, now a potential retest zone.
The Directional Movement Index (DMI) shows +DI (26.8) leading -DI (8.5) with a rising ADX (21.6) — a combination that supports an active uptrend, though not yet at peak strength.
Bollinger Bands on the daily chart are widening again, with price hugging the upper band. This typically indicates trend continuation, but overextension here may also trigger a temporary fade if volume does not follow through.
BTC Price Prediction: Short-Term Outlook (24H)
 BTC price dynamics (Source: TradingView)
In the next 24 hours, Bitcoin price needs to close decisively above $112,400 to confirm a sustained breakout. If bulls succeed, price could accelerate toward $114,900, the next R5 pivot resistance and upper channel boundary.
However, failure to hold current levels may bring a pullback to the $109,000–$108,200 support cluster. This zone includes the lower trendline, Supertrend support, and horizontal levels seen in the July 7–9 accumulation phase.
As long as BTC holds above $108,000, the trend remains constructive. But traders should monitor volume closely, especially as short liquidations dry up and momentum indicators flatten.
Bitcoin Price Forecast Table: July 11, 2025
| Indicator/Zone | Level / Signal |
| Bitcoin price today | $111,305 |
| Resistance 1 | $112,400 |
| Resistance 2 | $114,900 |
| Support 1 | $109,000 |
| Support 2 | $108,200 |
| EMA Cluster (20/50/100/200) | Bullish stack, lowest at $95,970 |
| Bollinger Bands (Daily) | Upper Band at $112,377 (testing) |
| VWAP (30-min) | $111,192 (price above, bullish) |
| DMI (14) | +DI 26.8 / -DI 8.5 / ADX 21.6 (bullish) |
| Supertrend (4H) | Bullish above $108,287 |
| Derivatives Volume | +71.75% ($97.11B), Long bias |
| Funding Rate | +0.0036% (positive) |
| Parabolic SAR (30-min) | Dots below price (bullish) |
Disclaimer: The information presented in this article is for informational and educational purposes only. The article does not constitute financial advice or advice of any kind. Coin Edition is not responsible for any losses incurred as a result of the utilization of content, products, or services mentioned. Readers are advised to exercise caution before taking any action related to the company.