Bitcoin flashes ‘highest bearish’ signal in years; $100,000 crash next? 
![]() Cryptocurrency Jul 20, 2025 Share
Cryptocurrency Jul 20, 2025 Share
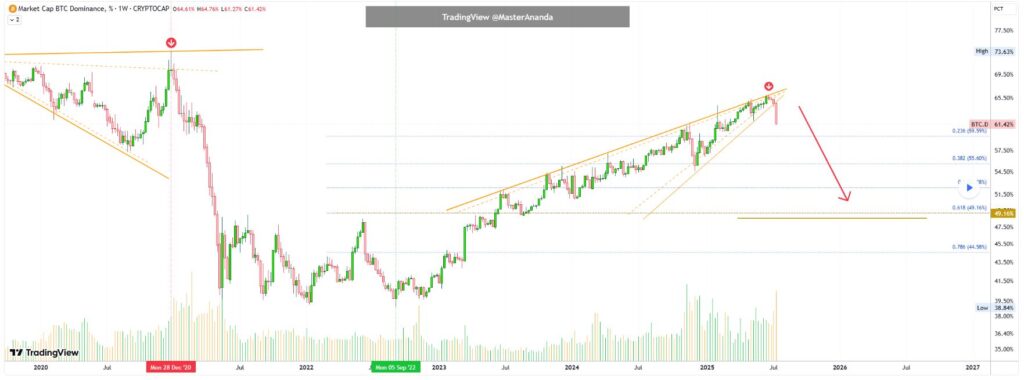
The Bitcoin Dominance Index has recorded its most bearish volume session since February 2021, signaling the strongest negative momentum in more than four and a half years.
According to analysis by Master Ananda, this breakdown could mark a key turning point in the cryptocurrency cycle, possibly foreshadowing a crash from the six-figure price levels, he said in a TradingView post on July 20.
 Bitcoin price analysis chart. Source: TradingView
Notably, the bearish signal has emerged as Bitcoin (BTC) attempts to reclaim the $120,000 level after recently hitting a record high above $123,000.
Ananda’s analysis indicates that Bitcoin dominance is breaking down from a steep ascending wedge on the weekly chart, a bearish pattern. The move is backed by a large volume candle, echoing the heavy selling pressure seen during the 2021 and 2022 peaks.
At the same time, altcoins are gaining momentum, with Ethereum (ETH) and Litecoin (LIT) leading the charge, while Solana (SOL), Cardano (ADA), and XRP are poised to follow. As Bitcoin consolidates near its resistance level, altcoins are steadily rising, signaling a maturing bull market.
Master Ananda also pointed out that technical indicators suggest Bitcoin dominance could fall to around 49.16%, aligning with the 0.618 Fibonacci retracement level, a historically strong area of support. A drop to this level would indicate a significant capital rotation from Bitcoin into altcoins.
Bitcoin next price level to watch
This trend, Ananda said, sets the stage for a major market shift. Once Bitcoin completes its consolidation, it is expected to resume its upward trajectory, with targets projected between $134,000 and $136,000.
However, a sudden correction, or even a sharp drop toward $100,000, remains a possibility if Bitcoin dominance continues to erode faster than expected.
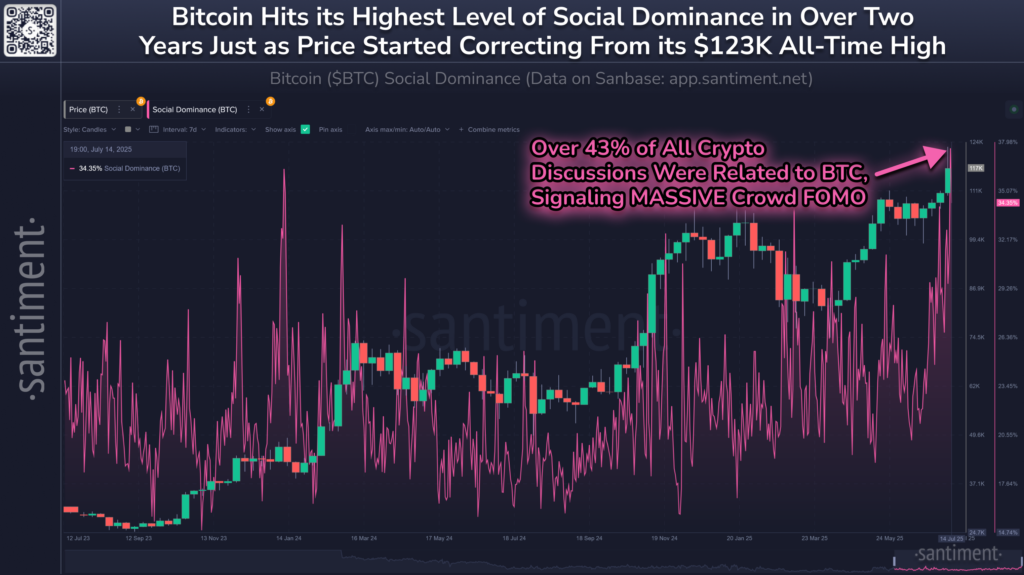
While Bitcoin’s volume appears to be weakening, social media activity around the asset has surged. Notably, since its climb to a new all-time high, Bitcoin has seen a dramatic spike in social media chatter, fueling concerns of a near-term pullback.
According to sentiment platform Santiment, nearly 43% of all crypto-related mentions this week were focused on Bitcoin, marking its highest “social dominance” in years. Analyst Brian Quinlivan noted that this spike suggests rising retail investor FOMO, often a signal of overheated market conditions.
 Bitcoin social sentiment data. Source: Santiment
Bitcoin price analysis
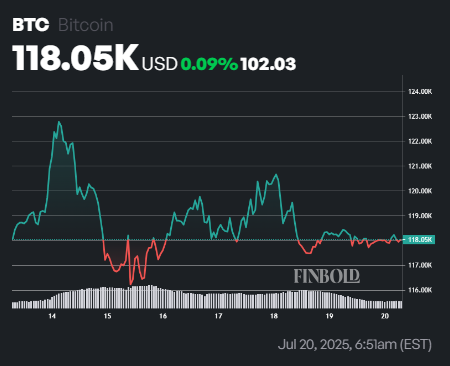
At press time, Bitcoin was trading at $118,052, down about 0.3% over the last 24 hours but still up 1.5% over the past week.
 Bitcoin seven-day price chart. Source: Finbold
Technically, Bitcoin’s 50-day simple moving average (SMA) sits at $108,727, indicating near-term strength, while the 200-day SMA at $89,326 reinforces the broader uptrend. However, the 14-day relative strength index (RSI) at 65.01 suggests approaching overbought territory, raising the risk of a pullback.
Featured image via Shutterstock.