Bitcoin just completed its strongest weekly run since May, a 9.07% gain that took prices from $109,231 to $119,400, en route to a new all-time high above $123,000. Can it keep it going?
This impressive weekly rally marks a decisive breakout from the consolidation pattern that had contained prices since late May. The Crypto Fear & Greed Index has climbed to 72, firmly in “greed” territory, reflecting renewed investor confidence across digital assets as institutional adoption accelerates.
Over on Myriad, a prediction market created by Decrypt’s parent company Dastan, users are firmly bullish on the idea of Bitcoin maintaining its momentum—for the most part. Predictors have now placed the odds at a whopping 91% that Bitcoin stays above $100K throughout the month of July, up from around 70% just days ago. Myriad users also now believe there’s a 76% chance Bitcoin hits the $125K price mark before sinking back to $105K.
In the short term, though, with the price of Bitcoin currently hovering around $119K after a mild correction, Myriad users are bearish at the moment that BTC closes the week above $122K, placing those odds at just 40%.
What does the macro picture say for BTC?
Bitcoin’s strongest week since May unfolded against a complex macroeconomic backdrop. Oil prices have gone back to a small bullish channel with West Texas Intermediate trading around $67 per barrel, while gold continues its run above $3,300 per ounce. These commodity price movements suggest ongoing inflation concerns and geopolitical tensions, which historically have driven interest in alternative assets like Bitcoin.
The S&P 500’s performance near record highs around 6,259 points indicates risk appetite remains healthy in traditional markets, creating a favorable environment for Bitcoin’s breakout. This broad-based strength across asset classes underscores Bitcoin’s emerging role as both a growth asset and a potential portfolio diversifier.
BTC price: Weekly charts confirm bullish trend
 Bitcoin price data. Image: TradingView
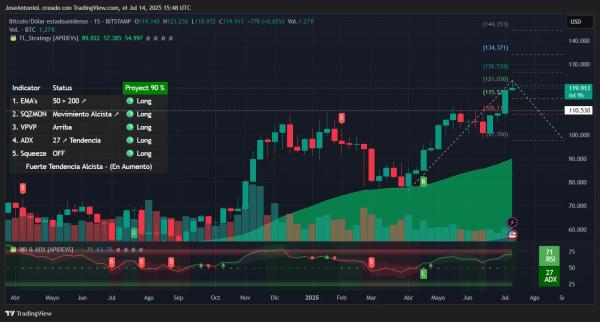
Bitcoin’s weekly chart reveals a powerful uptrend with multiple technical confirmations supporting further gains. The cryptocurrency closed the week at $119,913, showing strong momentum after breaking above the critical $110,530 resistance level.
The Relative Strength Index, or RSI, on the weekly timeframe sits at 71, indicating strong buying momentum that has just entered overbought territory. The RSI measures the speed and magnitude of price changes on a scale of 0-100, where readings above 70 typically signal overbought conditions. However, during powerful bull markets, assets can remain overbought for extended periods. The fact that Bitcoin maintained this momentum throughout the entire week suggests sustained buying rather than short-term speculation.
The Average Directional Index, or ADX, at 27 confirms a strong established trend, having crossed above the crucial 25 threshold. The ADX measures trend strength regardless of direction—readings below 20 indicate no trend, 20-25 show a developing trend, and above 25 confirm an established trend. This reading above 25 suggests Bitcoin’s rally has transitioned from development to a confirmed strong trend, typically indicating continuation potential.
It is also a breath of fresh air considering that, for weeks, Bitcoin has been trading sideways. A big price compression phase, a weak ADX and balanced RSI left traders wondering what the next big movement could be. Now, if all things remain equal, the bullish trend is no longer at risk—even the noisier daily charts have switched to a bullish outlook all around.
The Exponential Moving Averages, or EMAs, paint a decisively bullish picture on the weekly timeframe. The 50-week EMA is trending well above the 200-week EMA, which traders typically interpret as a healthy bullish formation. This configuration, where shorter-term averages trade above longer-term ones, is a classic bullish signal indicating sustained buying pressure. The expanding gap between these averages throughout the week confirms the strength and acceleration of the current uptrend.
The Squeeze Momentum Indicator finally shows an “off” status on the weekly chart, indicating that the volatility compression phase has been resolved with an upward breakout. This suggests the 9% weekly move represents a genuine trend acceleration rather than a false breakout, as the market has successfully released the pent-up energy from the previous consolidation period.
Bitcoin price: What comes next?
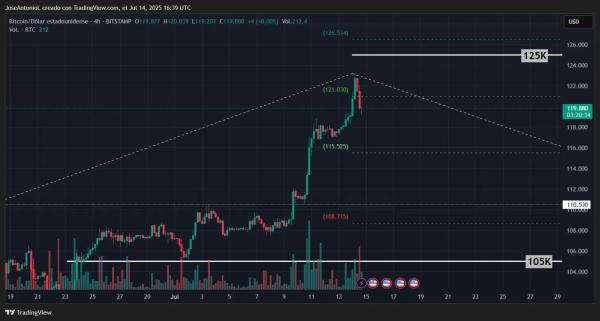
With Bitcoin now again in a price discovery zone, reading the charts may be a less accurate way to determine new price targets on the upside. What traders refer to as “Fibonacci extensions” suggest that, if the new all-time high does not turn into a resistance, BTC prices across exchanges may struggle to break past the $126K zone before going to $134K.
Fibonacci retracements are natural supports and resistances that tend to form between two price targets that traders already know—usually the moment in which a trend changed and the current price of an asset. A Fibonacci extension keeps the same proportions but tries to guess what the upcoming formations would be if the trend remains stable.
The $126,554 and $134,371 Fibonacci extension targets visible on the chart below.
Supports are easier to determine. The immediate level sits at around $115,575 (previous weekly resistance) and a much stronger support around $110,500.
This aligns with the odds currently placed on Myriad Markets for Bitcoin’s next hit. The $125K price mark is below the Fibonacci extension that would act as resistance, whereas the $105K support would require a bearish breakout below the $110,500 support to levels not seen since June. The bullish outcome, though, is pure speculation whereas the bearish price target is based on previous movements.
 Bitcoin price data. Image: TradingView
The volume profile visible on the weekly chart shows significant accumulation in the $90,000-$110,000 range, creating a strong foundation for the current move. The relatively thin volume above $120,000 suggests less resistance for further gains once Bitcoin establishes support at current levels.
The prudent thing to do for a trader who keeps an eye on charts is to monitor weekly ADX levels maintaining above 25 for trend continuation and watch for any weekly RSI divergence if approaching the 80 mark. It wouldn’t be surprising to see traders structure stop loss orders near the previous all-time high and raise it up proportionally to a new price spike. That typically helps protect funds against further losses, considering there is always a price correction after a new all-time high.
After all, nobody will blame you for taking a little profit here to buy a bottle of champagne.
Disclaimer
The views and opinions expressed by the author are for informational purposes only and do not constitute financial, investment, or other advice.