Bitcoin traded at $83,681 on April 13, 2025, with a market capitalization of $1.66 trillion, a 24-hour trading volume of $26.01 billion, and an intraday price range between $83,648 and $85,731, as the asset moved within a tightening technical consolidation.
Bitcoin
On the daily chart, bitcoin ( BTC) continued its recovery from a recent pullback low near $74,434, climbing within a defined range capped by resistance at $88,000. The market showed moderate upward momentum, but the price action remained largely confined between support around $74,000 and resistance just below $88,000. Notably, volume surged near the lower bound, a classic signal of potential accumulation or capitulation. Traders looking for long entries are advised to consider the $80,000 to $82,000 support band, while exit strategies should target the upper boundary unless supported by breakout volume.
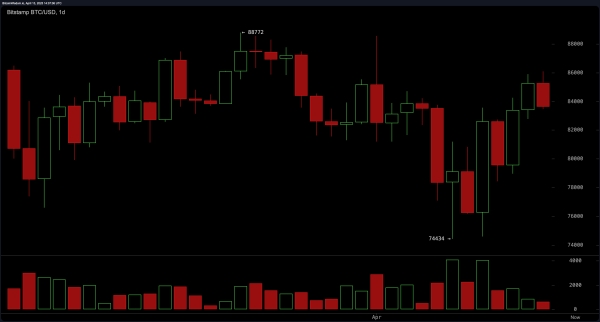 BTC/USD 1D chart via Bitstamp on April 13, 2025.
The four-hour chart revealed a bounce off $74,588 and a sustained upward push to $86,084, although recent candles showed diminishing bullish strength. The slowdown suggests profit-taking and the emergence of short-term resistance. As momentum fades, the $82,000–$83,000 area stands out as a potential re-entry zone, aligning with prior breakout levels. Should price action struggle to hold above $85,000, a pullback may target lower support levels. The trend remains upward but tentative, warranting close observation of candlestick behavior and volume spikes.
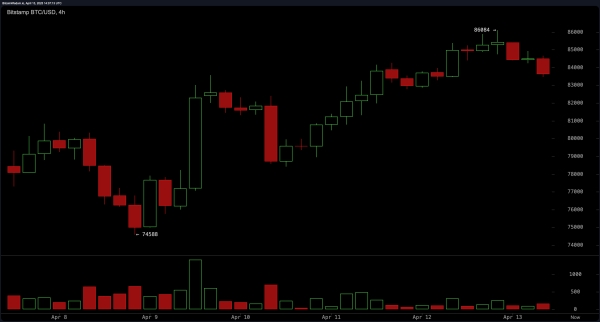 BTC/USD 4H chart via Bitstamp on April 13, 2025.
On the one-hour chart, BTC faced a local decline from $86,000 to approximately $83,500, accompanied by increased selling pressure as evidenced by growing volume on red candles. Immediate support was identified near $82,784, marking a previous intraday low. A short-term bounce from this level could extend to resistance around $85,500. However, traders should be prepared for volatility and maintain disciplined stop-loss levels to mitigate risk during potential breakdown scenarios.
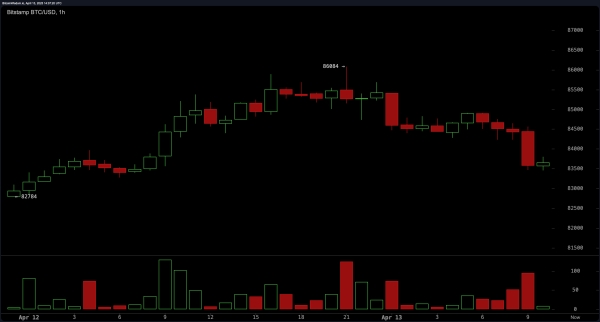 BTC/USD 1H chart via Bitstamp on April 13, 2025.
Oscillators on the BTC/USD daily chart painted a picture of market indecision, with the relative strength index (RSI), Stochastic, commodity channel index (CCI), average directional index (ADX), and awesome oscillator all positioned in neutral territory. The momentum oscillator, however, issued a bearish signal, while the moving average convergence divergence (MACD) presented an optomistic signal, reflecting a split in directional conviction. These conflicting signals support a thesis of consolidation rather than clear directional strength.
The daily chart’s moving averages (MAs) offered further confirmation of mixed sentiment. Short-term indicators such as the exponential moving average (EMA) and simple moving average (SMA) over the 10-, 20-, and 30-period windows favored a bullish stance. In contrast, longer-term indicators — including the 50-, 100-, and 200-period EMA and SMA — all suggested selling conditions. This technical divergence underscores the presence of short-term optimism amid broader structural hesitation, reinforcing a cautious, range-based approach until the market breaks convincingly in either direction.
Bull Verdict:
If bitcoin can hold above the $82,000–$83,000 range and print a bullish reversal pattern supported by rising volume, there is a strong case for a continuation toward the $88,000 resistance. A confirmed breakout above this level, particularly on the daily chart, would shift the structure decisively bullish, potentially opening the path to new highs beyond $90,000.
Bear Verdict:
Failure to maintain support near $82,000—especially if accompanied by increased selling volume—could trigger a deeper correction back toward the $78,000 level. A break below that threshold would confirm a short-term trend reversal, increasing the likelihood of a test of the broader $74,000 support zone, with bearish momentum gaining traction across higher timeframes.