Bitcoin’s rally to a new all-time high of $122,054 has triggered a wave of profit-taking across the market. On-chain data shows signs that institutional appetite may also be cooling.
After a strong six-week streak of net inflows into US-listed spot Bitcoin ETFs, this week has seen a reversal, with several funds recording outflows.
Institutional Investors Pull $199 Million From BTC ETFs
According to data from SosoValue, spot Bitcoin ETFs have reversed their six-week streak of net inflows, recording outflows totaling $199 million this week. The shift marks a significant sentiment change among institutional investors, who had steadily accumulated BTC exposure through ETFs throughout much of the recent rally.
For token TA and market updates: Want more token insights like this? Sign up for Editor Harsh Notariya’s Daily Crypto Newsletter here.
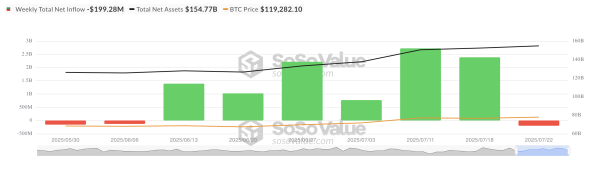 Bitcoin Spot ETF Net Inflow. Source: SosoValue
This pullback follows the coin’s surge to a new all-time high of $122,054 on July 14. Several investors who had been eyeing a decisive breakout above $120,000 appear to have seized the opportunity to exit positions and lock in gains.
ETF flows are widely regarded as a key indicator of institutional confidence. A sharp drop in inflows, especially following sustained accumulation, suggests that institutional risk appetite is cooling. It means that even seasoned holders—often seen as having “diamond hands”—appear to be taking profits.
While this is not necessarily a sign of long-term bearishness, it does reflect growing short-term caution in the market.
Additionally, Glassnode data shows weakening on-chain activity, which could exacerbate BTC’s downside risks. According to the data provider, the number of active unique addresses on the Bitcoin network has plummeted gradually over the past seven days. Yesterday, it closed at a weekly low of 721,086 addresses.
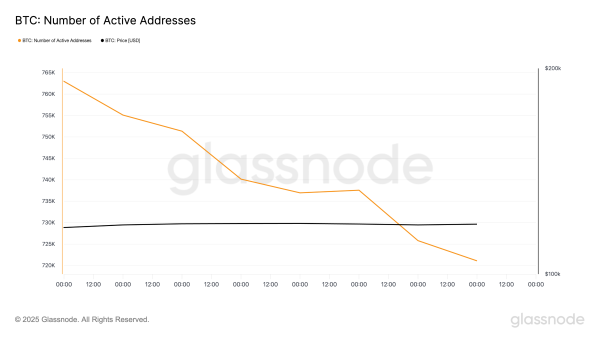 BTC Number of Active Addresses. Source: Glassnode
When institutional capital begins to pull back and retail activity slows simultaneously, it indicates a broader market pause, increasing the chances of a near-term BTC price correction.
BTC Eyes $120,000 Breakout, But Weak Demand Threatens Drop
Readings from the BTC/USD one-day show that the king coin has mostly trended within a range since reaching an all-time high of $122,054 on July 14. It now faces resistance at $120,811, with a support floor formed at $116,952.
With waning demand, the coin risks testing this support level. BTC’s price risks falling to $114,354 if it fails to hold.
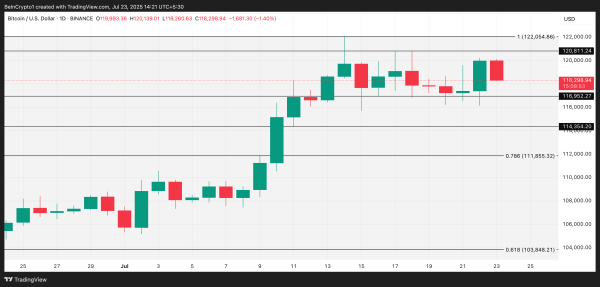 BTC Price Analysis. Source: TradingView
However, if new demand enters the market, the coin could breach the $120,811 barrier and attempt to reclaim its all-time high.