Bitcoin’s price action is full of wild swings and significant technical indicators enough to capture the interest of traders. At the time of this writing, Bitcoin continues to trade at $80,010.42 (77,344.88), representing a 3.76% increase over the previous day.
Recent price action has determined a struggle between the bulls and bears, with significant indicators signaling future challenges. Will Bitcoin bounce back amid such conditions?
Are Technical Indicators Alarming Signals?
Tremendous information on Bitcoin’s momentum can be observed from the MACD and RSI. The MACD line at -1002.04 dips below the signal line -1183.90, indicating a bearish crossover in the MACD (12,26).
The histogram reading of 181.86 reinforces this divergence and shows increasing waning bullish momentum. The RSI, on the other hand, is just barely above the overbought zone, continuing to circle around 69,000.
This is an indication of possible buyer exhaustion, but again, not significant. Collectively, these signals can suggest that if selling pressure builds, the bears would aim at $78,652.76 as their next target and move price action lower.
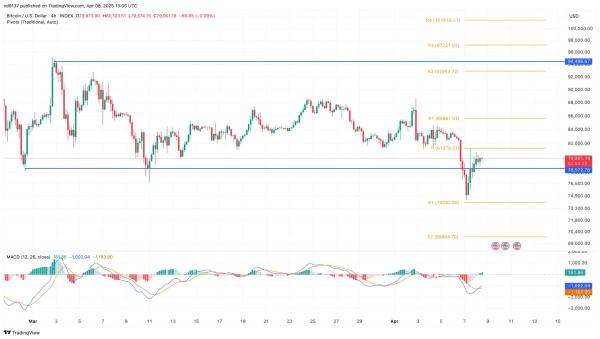 Bitcoin Price Chart
source:TradingView
In a recent post by analyst Ali on X, Bitcoin is flashing a weekly TD sequential buy signal. Holding above $74,500 and breaking past $82,000 could confirm a move to $88,000. However, failure to maintain these levels risks a pullback, with support near $74,480 critical to watch.
#Bitcoin $BTC is flashing a weekly TD Sequential buy signal. Holding above $74,500 and breaking past $82,000 could confirm a move to $88,000! pic.twitter.com/9av6QcwtMH
— Ali (@ali_charts) April 8, 2025
Bitcoin’s $80k Rally Triggers Whale Rollovers: Will Liquidations Kill the Rally?
The development of the April 7 liquidation data by CoinGlass illustrates how susceptible Bitcoin can be to sudden and immense downward moves. Initially, the price dipped to $77,318 before a series of sell-offs occurred in conjunction with heightened leverage around the $80,000 mark.
Currently, Bitcoin is trading near the pivotal price point of $79,901.18, where pricing has been volatile. Liquidations may accelerate, reaching S1 at $74,292.00 if bulls don’t defend S2 at $78,652.76.
However, if traders are able to bullishly and decisively break above $80,103.51, they may get kicked into motion all the way to $92,943.72.
According to the tweet by Ali Martinez, the Bitcoin price went from $74,500 to $81,200, along with the occurrence of the 1,715 whale transactions slightly above $1 million, according to Santiment.
1,715 whale transactions of over $1 million hit the network yesterday right as #Bitcoin $BTC surged from $74,500 to $81,200, as shown by on-chain data from @santimentfeed! pic.twitter.com/IEboSEhEKg
— Ali (@ali_charts) April 8, 2025
The increase in large transactions is an indicator of whale activity when it comes to the price action in the last few days. After the price action, we see a pullback to around $80,000. This likely shows that there is some profit-taking or resistance met, so a cautious eye moving forward is warranted.
Conclusion: Will Bitcoin Break or Bend?
Bitcoin’s battle at $80,000 now depends on the ability to hold critical support. Although signs are appearing bearish (with risks of liquidation) and a possible retreat among price action is shown on the MACD, they remain hopeful with solid buying around S2 at $78,652.76.
Expect continued volatility, as any dip to the S2 at $78,652.76 would favor the bears, while any breakout above $80,103.51 would spark a return to bullish confidence. Traders should look closely at the volume behind the whale behavior.