- Bitcoin CME gaps drive weekend volatility, often retraced during traditional market reopenings.
- BTC price closely tracks global M2 expansion, signaling macro-driven growth potential.
- Bitcoin holds above $83K, eyes $84K resistance amid strong recovery from $81,570 support zone.
Bitcoin (BTC) continues to display price movements closely aligned with institutional trading patterns and global monetary expansion. Recent changes in the crypto market highlight Bitcoin’s sensitivity to CME Futures gaps and the expanding global M2 money supply, signaling key factors that traders are monitoring for future price direction.
Market data shows that Bitcoin has formed a CME (Chicago Mercantile Exchange) gap for six consecutive weekends, reflecting a pattern gaining attention among traders. Historically, Bitcoin’s price remained relatively stable over weekends, but recent activity has seen increased volatility and headline-driven moves during these periods.
As reported by Daan Crypto Trades, most of the weekend movements were reversed the following week. This implies that irrespective of short-term volatility during the weekend, the Bitcoin rate usually returns to where it was on the day the CME opens.
$BTC Has made a weekend gap 6 weeks in a row now.
Where price used to do pretty much nothing during the weekends, we’ve now been seeing a lot of volatility and headlines causing all kinds of price movements.
But what we’ve also seen is that whenever a move is made during the… pic.twitter.com/D4eEGqcNMs
— Daan Crypto Trades (@DaanCrypto) April 12, 2025
Bitcoin’s 15-minute candlestick has it trading within a defined range according to the Binance markets after the CME close. A red resistance zone above it shows a high intensity of trading activity since the price reversed the CME gap below it. The chart includes a magnet icon near the anticipated CME open, reflecting expectations for the price to gravitate toward that level.
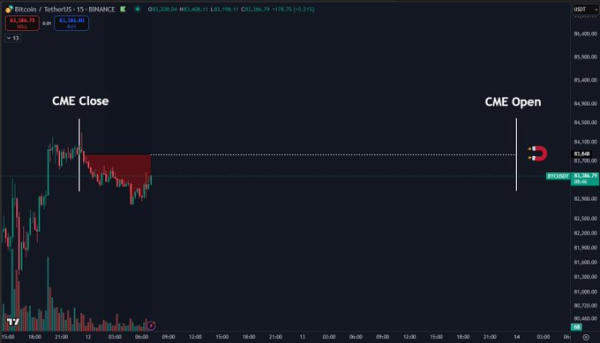 Source: X
This trading behavior points out the influence of institutional trading patterns on Bitcoin’s price. The CME gap phenomenon has become a focal point for market participants, with price fills around these levels often signaling renewed volatility or reversals.
Bitcoin Correlates with Global M2 Money Supply Expansion
Alongside the CME-driven price action, Bitcoin’s long-term behavior strongly correlates with the expansion of global liquidity. A recent comparative chart highlights the relationship between Bitcoin’s price and the global M2 money supply, representing liquid assets like cash, deposits, and easily convertible financial instruments.
In the past, it became evident that Bitcoin tends to underperform when there is an expansion in M2 when monetary conditions are tight. However, this last chart shows recently increasing in world M2, which indicates the central to the rising movement of Bitcoin price.
Adding to this sentiment, BitBull, a crypto analyst, noted that Bitcoin’s lag behind the expanding money supply remains noticeable. This observation adds to market expectations that a substantial price move — commonly called a “God candle” — could occur if Bitcoin continues to follow historical patterns of catching up with liquidity growth.
Historically, $BTC lags behind money supply expansion — and the gap is WIDE right now.
A GOD candle may not be a matter of “if”… but when.
Good Morning 🤞 pic.twitter.com/UzUpStLTwK
— BitBull (@AkaBull_) April 12, 2025
Bitcoin Price Holds Above $83,000 Amid Market Recovery
As of the latest data, Bitcoin is trading at $83,633.18, reflecting a 2.48% gain over the past 24 hours. The market capitalization has reached $1.66 trillion, with the circulating supply at 19.85 million BTC out of a maximum of 2 million.
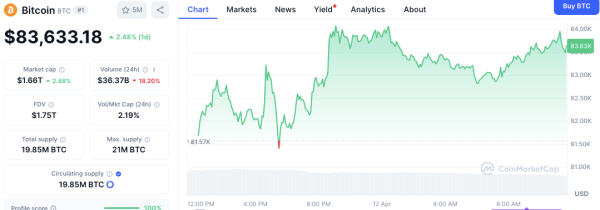 Source: CoinMarketCap
Although the price has rocketed in recent times, the trading volume declined to $36.37 billion, decreasing by 18.20% from the previous period. The intraday chart, though depicted below the $ 82,000 mark in the early hours, showed sharp upward momentum in the later part of the chart and is now trading above $ 83,000.