Brace yourself: Bitcoin could crash to $31,000 soon 
![]() Cryptocurrency Sep 8, 2024 Share
Cryptocurrency Sep 8, 2024 Share
Investors looking for a possible bullish reversal in Bitcoin’s (BTC) price will have to wait longer, as an analyst is projecting further downside.
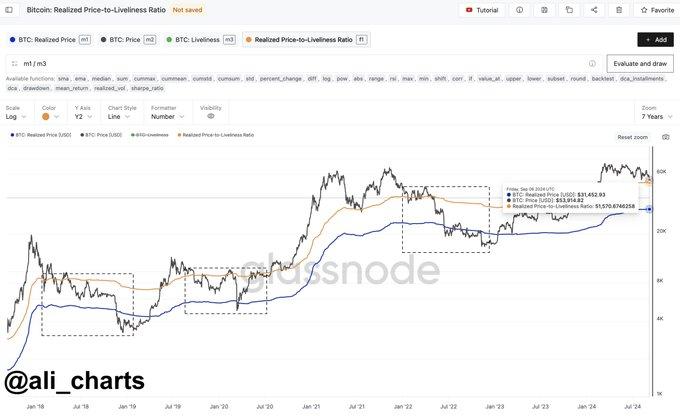
According to Ali Martinez, Bitcoin’s historical behavior, when compared to the current price movement around the realized price-to-live ratio (RPL), signals a further drop below the $50,000 mark. He made this projection in an X post on September 7.
It’s worth noting that the RPL ratio is used to identify potential price tops and bottoms. The metric considers Bitcoin’s realized price and liveliness, a measure of the movement of long-term versus short-term holders. The outcome is used to generate insights into prevailing market sentiments.
Picks for you
‘September Effect is in full bloom’ as ‘US jobs disappoint,’ warns finance expert 1 hour ago 'Stay strong': Here's what it takes for Bitcoin to reach $93,000 4 hours ago Meta AI builds ideal portfolio for the 2024 crypto bull run 21 hours ago Analyst says Bitcoin’s 2024 ‘capitulation is not over’, sets new bearish targets 21 hours ago
In this context, the analyst noted that historically, when Bitcoin dips below the RPL ratio, the subsequent trajectory often leads to a sustained drop toward the realized price.
According to Martinez’s data shared from crypto analysis platform Glassnode, the ratio currently stands at $51,600, with Bitcoin trading slightly above this level. In his analysis, investors should anticipate additional losses, possibly down to the $31,500 zone, if the maiden cryptocurrency shows weakness and drops below this threshold.
 Bitcoin realized price-to-live ratio chart. Source: Glassnode/Ali_charts
This suggests that, with the general cryptocurrency market lacking notable news to trigger a rally, the coming days remain crucial for Bitcoin’s prospects. Notably, growing economic uncertainty has weighed down Bitcoin.
Bitcoin’s next record high
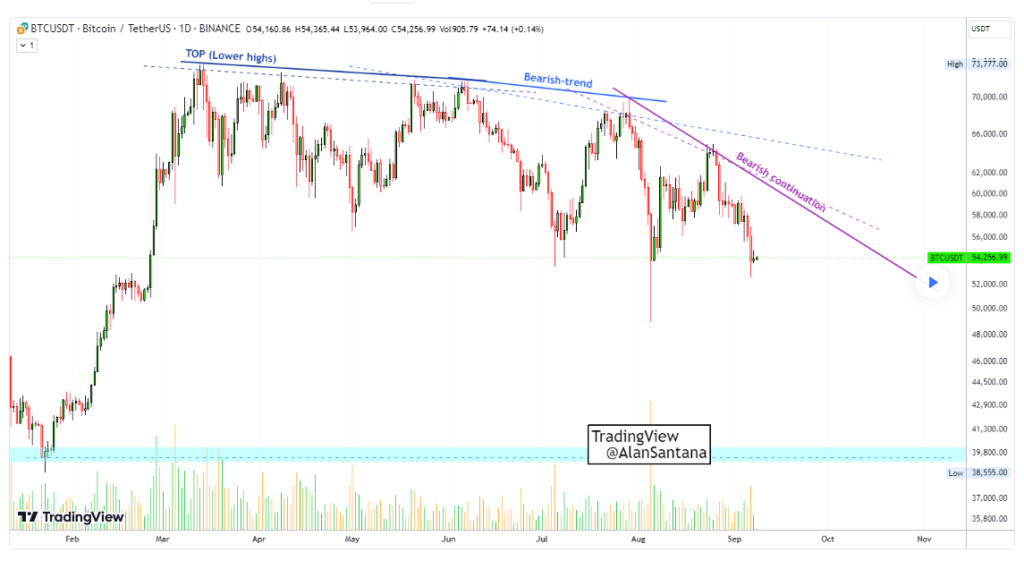
For investors looking for optimism, it is worth mentioning that some analysts believe that the ongoing Bitcoin price adjustment may be the turning point leading to the beginning of the bullish phase. Specifically, Alan Santana, in a TradingView post on September 8, pointed out that an upcoming bull market could see Bitcoin hit $100,000 by 2025.
 Bitcoin price analysis chart. Source: TradingView/Alan Santana
However, the market expert warned that the ongoing correction is not over. Once the bottom is reached, investors should brace for higher highs and lows.
Regarding timelines, the expert anticipates that Bitcoin’s growth will be slow between December 2024 and February 2025, but the asset will potentially be moving upward.
“We can say it will take some time to break resistance, the barriers, and so after March/April 2025 we can see the light and we are now aiming toward $100,000. I don’t know if it will hit right on April or May or later down the road, but it will take a while. In short, Bitcoin is likely to hit $100,000 after March 2025,” he said.
Santana’s latest prediction adds to his initial warning that Bitcoin will undergo a ‘capitulation event’ in 2024, which will see the price hit bottom of around $30,000.
Bitcoin signals bullish reversal
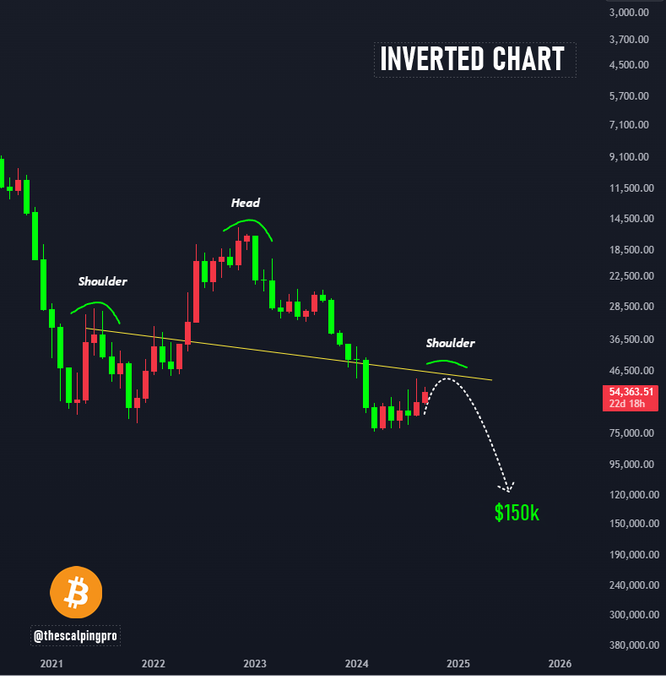
Meanwhile, another analyst with the X pseudonym Mags observed that technical indicators suggest Bitcoin could build the foundation to hit a $150,000 record high. According to the expert, ‘Bitcoin is forming a massive head and shoulders pattern on the inverted chart.’ The formation of this pattern hints that Bitcoin could be setting up to reverse from the current bearish trend.
 Bitcoin price analysis chart. Source: Thescalpingpro
Bitcoin price analysis
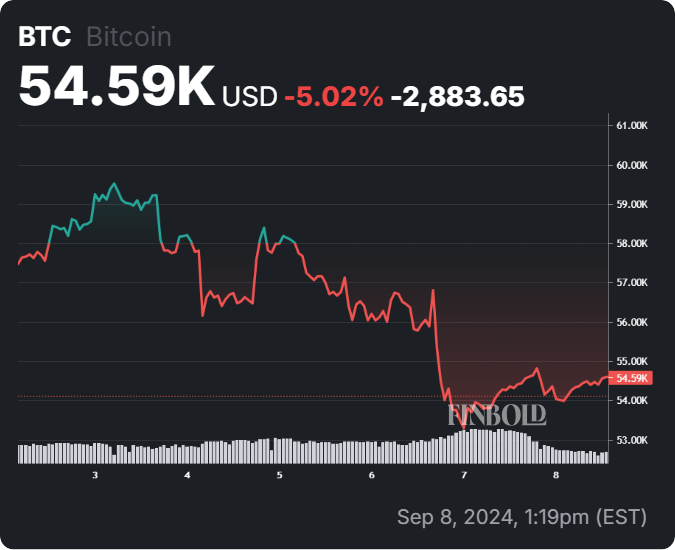
Following Bitcoin’s drop from the $58,000 mark, the cryptocurrency has entered a short-term consolidation phase below the $55,000 resistance zone. As such, BTC has corrected by about 1% in the last 24 hours to trade at $54,590 as of press time, while on the weekly timeframe, the asset is down 5%.
 Bitcoin seven-day price chart. Source: Finbold
On the other hand, Bitcoin’s technical analysis retrieved from TradingView points to bearishness. A summary of the one-day gauges recommends a ‘sell’ sentiment at 14, while moving averages indicate a ‘strong sell’ at 12. However, oscillators remain in the ‘neutral’ zone at 6.
 Bitcoin one-day technical analysis. Source: TradingView
In summary, if Bitcoin fails to break past the $55,000 resistance, there is a high possibility that the asset could reach the $30,000 target set by Martinez and Santana.
Disclaimer: The content on this site should not be considered investment advice. Investing is speculative. When investing, your capital is at risk.