Did Trump just signal Bitcoin to $120,000 in coming weeks? 
![]() Cryptocurrency Jul 7, 2025 Share
Cryptocurrency Jul 7, 2025 Share
Bitcoin (BTC) bulls may have found an ally in President Donald Trump’s move to delay controversial trade tariffs.
To this end, cryptocurrency analyst Ted Pillows has noted that Bitcoin’s recent price action is tracking a Wyckoff accumulation pattern, and Trump’s tariff delay could catalyze BTC to surge toward $120,000 in the coming weeks.
In a July 7 X post, Pillows noted that Bitcoin’s BTC/M2 ratio is nearing the end of its accumulation phase. Notably, M2 is a broad measure of the money supply, and as it expands, liquidity increases, providing investors with more capital to deploy into assets like Bitcoin.
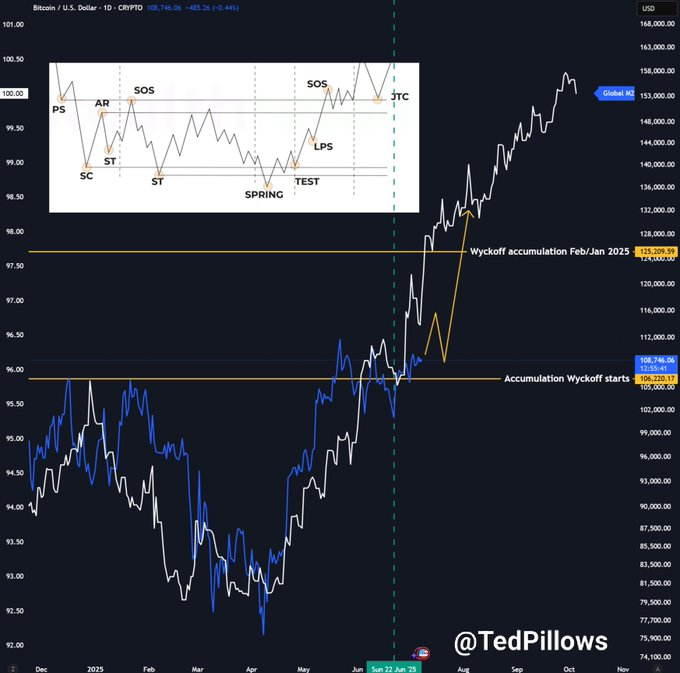 Bitcoin price analysis chart. Source: Ted Pillows
By comparing Bitcoin’s price to M2, analysts assess its value in relation to the available liquidity. A strong BTC/M2 ratio can indicate that Bitcoin is undervalued compared to the money circulating in the system.
Pillows’ analysis shows the BTC/M2 chart completing a Wyckoff accumulation phase, where institutional buyers quietly absorb supply before driving prices higher.
Over the weekend, Bitcoin saw a sharp pullback but quickly rebounded, matching the Wyckoff pattern’s typical “spring” phase before a strong move up.
Impact of Trump tariffs on Bitcoin’s price
Trump’s tariff decision is central to this bullish outlook. By threatening higher tariffs but delaying them until August 1, the administration has given markets a short-term reprieve from trade uncertainty, potentially supporting a move higher for Bitcoin.
Generally, reduced trade tensions lower the risk of an economic slowdown and support risk assets, such as equities and cryptocurrencies.
Pillows’ analysis indicated that accumulation started around $105,000 to $108,000, with a Wyckoff target near $125,000.
Meanwhile, another bullish outlook came from analyst TradingShot, who noted in a July 7 TradingView post that Bitcoin is testing short-term support at its four-hour 50-period moving average (MA50) after forming a golden cross.
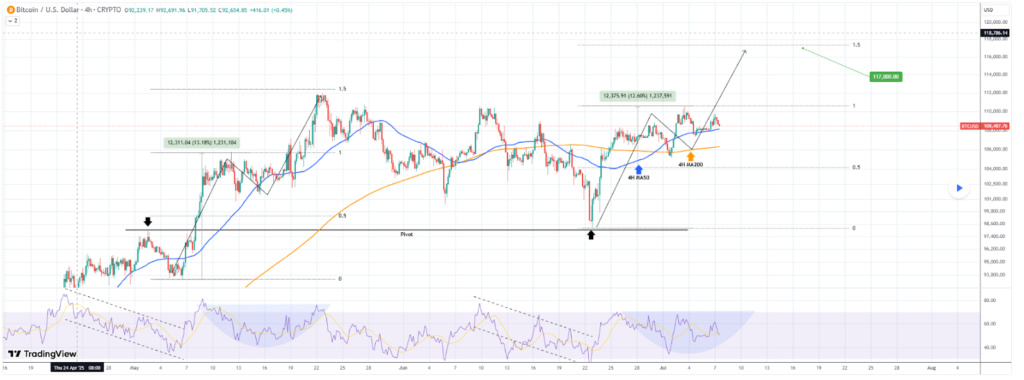 Bitcoin price analysis chart. Source: TradingView
The analyst sees similarities to May’s rally, with nearly identical gains from recent lows, 13.60% in May versus 12.60% now, and matching four-hour RSI patterns.
If this fractal continues, Bitcoin could target the 1.5 Fibonacci extension level around $117,000 in the near term.
At press time, Bitcoin was trading at $108,263, having experienced a modest 0.5% pullback over the last 24 hours, while it was down 1% for the week.
Featured image via Shutterstock