Machine learning algorithm predicts Bitcoin’s price for August 31 
![]() Cryptocurrency Aug 19, 2024 Share
Cryptocurrency Aug 19, 2024 Share
Bitcoin (BTC) has failed to break past the $60,000 resistance zone, with the maiden cryptocurrency consolidating below this level. A break above the $60,000 resistance is a significant catalyst likely to propel Bitcoin to a new all-time high.
Amid the current price movement, Bitcoin has witnessed increased whale activity as investors anticipate a possible breakout.
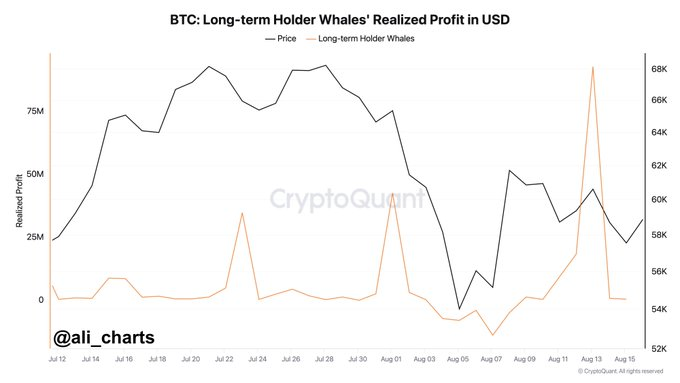
For instance, crypto analyst Ali Martinez shared data in an X post on August 19, revealing that Bitcoin whales have recently realized over $92.7 million in profits. According to the latest data from CryptoQuant, a surge in profit-taking activity occurred between late July and mid-August.
Picks for you
R. Kiyosaki’s top crypto picks for end of 2024 1 hour ago Bitcoin Rainbow chart predicts BTC price for 2025 2 hours ago Meta AI predicts Gold price for 2025 3 hours ago Donald Trump’s crypto portfolio revealed 16 hours ago  Bitcoin whales realized profits. Source: CryptoQuant
Notably, there was a spike on August 9, coinciding with a period when Bitcoin was recovering after a flash crash below the $50,000 mark.
Bitcoin price prediction
Amid this increased whale activity and consolidation, attention is focused on how Bitcoin will trade in the coming days. Notably, considering that Bitcoin closed in red in July, there is a focus on how the cryptocurrency will end in August.
In this regard, the advanced artificial intelligence (AI) and machine learning algorithms deployed by the crypto market forecasting platform PricePredictions suggest that Bitcoin will likely see a correction phase in the coming days.
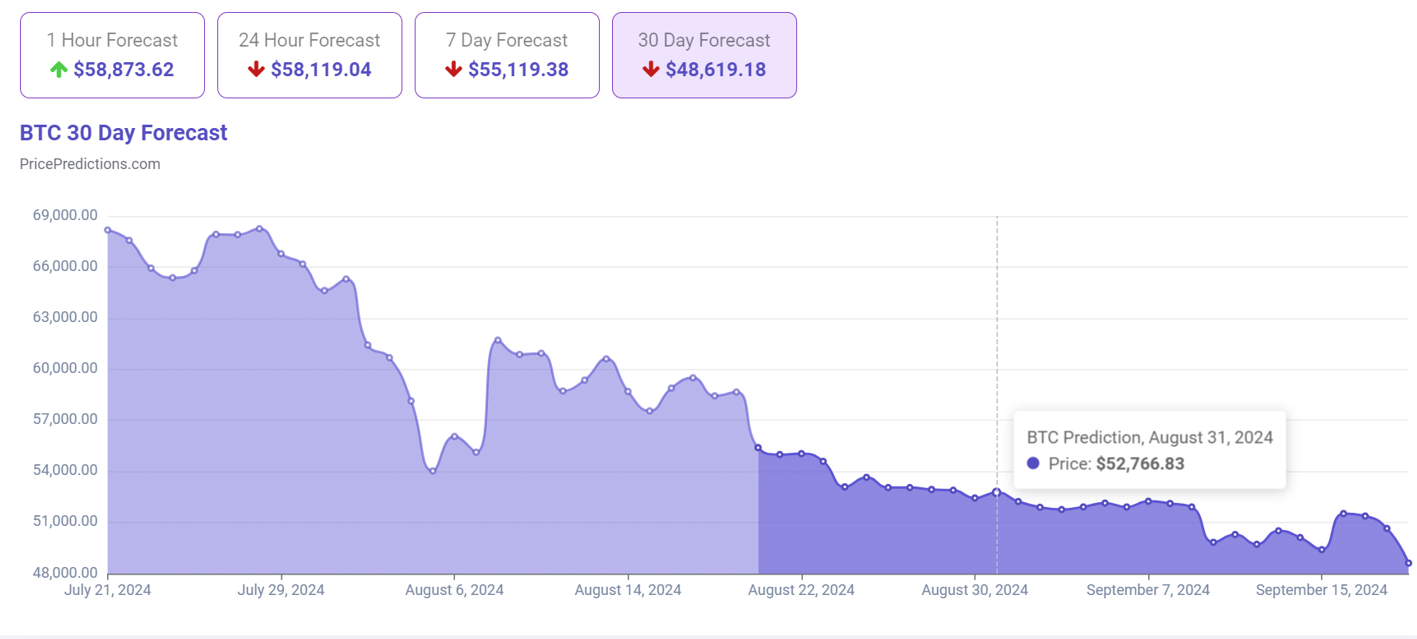
According to data retrieved on August 19, the platform projects that Bitcoin will likely trade at $52,776 on August 31. This value reflects a drop of almost 10% in Bitcoin’s price.
 Bitcoin price prediction for August 31. Source: PricePredictions
In forming these predictions, the platform leverages factors in technical analysis (TA) indicators like moving average convergence divergence (MACD), relative strength index (RSI), Bollinger Bands (BB), and others.
Bitcoin price analysis
It’s worth noting that the prediction aligns with the majority of market analysts who believe Bitcoin is likely to undergo consolidation in the short term before a possible breakout.
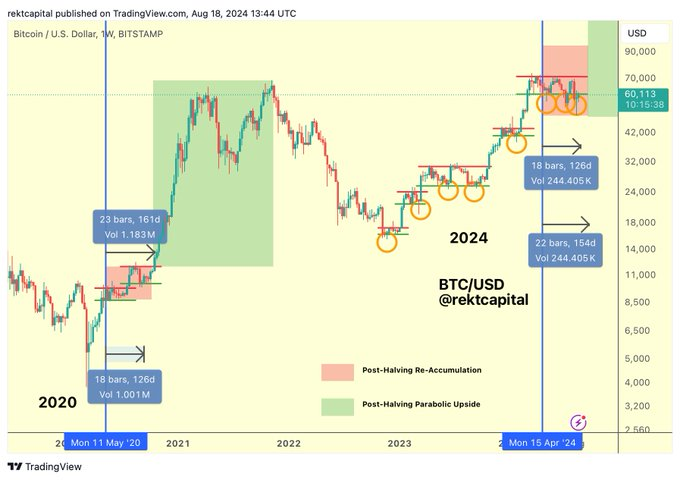
For instance, analyst Rekt Capital suggested in an X post on August 18 that Bitcoin is currently around 125 days post-halving, a critical phase in its market cycle during which significant price movements have historically been observed.
Historically, Bitcoin tends to break into a parabolic phase approximately 160 days after a halving event. If this pattern holds, Bitcoin may be just over a month away from a significant price surge, potentially occurring in late September 2024.
 Bitcoin price analysis chart. Source: TradingView/Rekt Capital
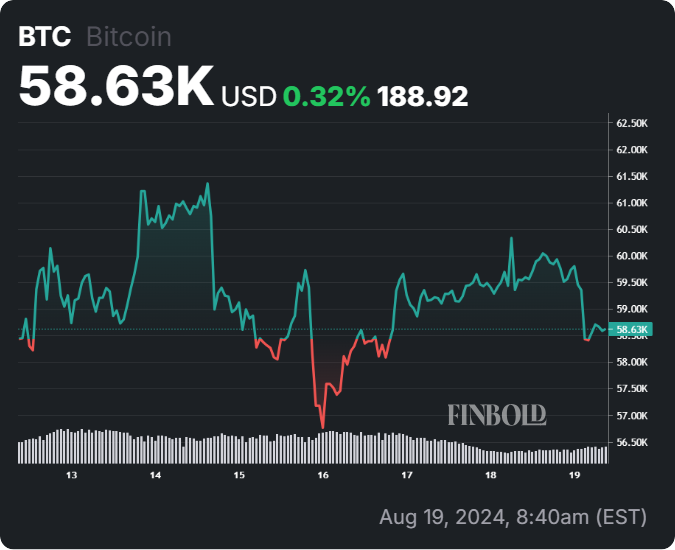
In the meantime, Bitcoin was trading at $58,625 with daily losses of almost 2%. On the weekly chart, BTC is up 0.55%.
 Bitcoin seven-day price chart. Source: Finbold
Overall, the focus remains on Bitcoin bulls’ short-term activity, as their input is crucial in helping Bitcoin reclaim the $60,000 resistance and exit the current consolidation phase.
Disclaimer: The content on this site should not be considered investment advice. Investing is speculative. When investing, your capital is at risk.