Monster $1.5 billion Solana short squeeze alert 
![]() Cryptocurrency Jun 19, 2025 Share
Cryptocurrency Jun 19, 2025 Share
Solana (SOL) is trading at $145.50, but under the surface, tension is building across derivatives markets. The latest 30-day Solana Exchange Liquidation Map from Coinglass shows an escalating wave of short-side leverage clustered just above current price, setting the stage for a potential $1.5 billion short squeeze if bulls push the token beyond its immediate resistance zone.
At first glance, the setup looks eerily similar to what we’ve seen with Bitcoin and XRP in recent weeks: a rising cumulative short liquidation curve (green), bar clusters thick with high-leverage shorts, and a flatlining long liquidation zone (red), suggesting asymmetrical risk.
But Solana’s chart takes it up a notch.
A closer look at Solana’s Liquidation Map
The liquidation map reveals that short positions start building heavily from around $146, just a dollar above the current price. From there, the green curve steepens dramatically through $150, $155, and all the way to $170, indicating a parabolic rise in short liquidation leverage.
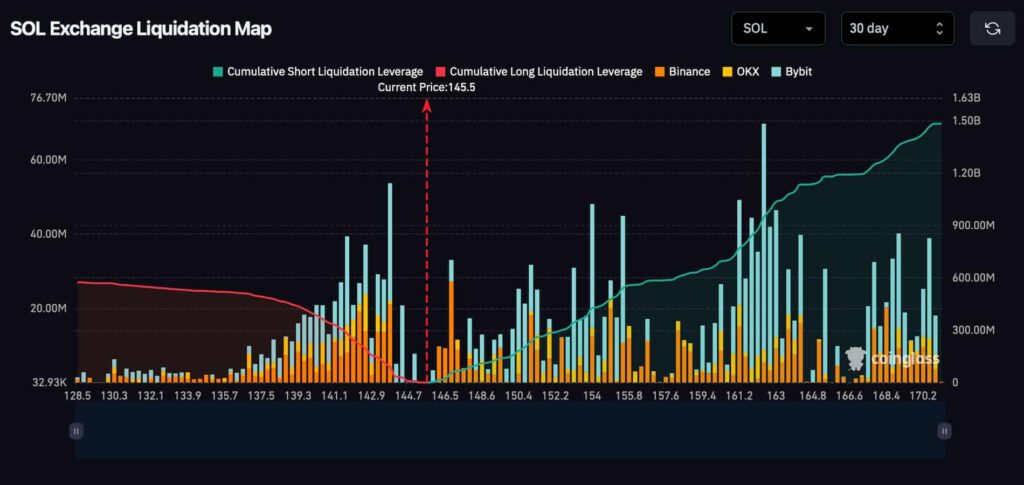 Solana Exchange Liquidation Map. Source: Coinglass
This buildup tells us one thing: traders across Binance, OKX, and especially Bybit have aggressively shorted Solana between $146 and $170, expecting a local top or pullback. But if price begins to climb through that zone, those short positions begin to auto-liquidate, triggering forced buybacks and sending the price higher in a feedback loop.
The largest liquidation clusters appear between $150 and $163, with some single levels showing more than $60–75 million in exposure, mostly on Bybit. That suggests retail and aggressive leverage traders have entered positions with tight stops and high risk profiles.
Why this setup matters
With low spot volume and thinning resistance levels, it doesn’t take much to push SOL into a zone where shorts get flushed out rapidly.
If Solana can break and hold above $146–$148, a chain reaction becomes likely. The liquidation map shows no significant resistance zones above that level until the mid-$160s. That gives SOL at least $15–20 of clean air before encountering serious sell pressure, plenty of room for liquidation-fueled price expansion.
On the flip side, failure to break above $146 could embolden bears. But with short exposure this elevated, a downside rejection becomes less sustainable because it would mean millions of dollars in still-open shorts remain vulnerable to even minor bullish spikes.