Bitcoin is once again making waves in the financial world. As of Friday, the price of Bitcoin (BTC) remains right around the $107,000 mark, reinforcing investor confidence and raising hopes for another surge toward its monthly and all-time highs.
The Crypto Fear and Greed index is currently at 65, which means sentiment in the BTC market is currently in “greed” mode and traders are eagerly buying.
Myriad, a prediction market developed by Decrypt’s parent company Dastan that allows for the trading of event contracts, provides a glimpse of current investor sentiment. A market titled “Bitcoin’s next hit: moon to $115K or dip to $95K?” launched on June 18 and has seen the odds on Bitcoin’s next move flip back and forth since then.
Myriad traders have been remarkably bullish on Bitcoin since June 22, when the mood shifted dramatically from 30% to 61.2% expecting Bitcoin to reach $115,000 before dropping to $95,000. The market closes on December 31, or when Bitcoin hits either the $115K or $95K mark, whichever comes first.
Adding another layer to the analysis, the Altcoin Season Index currently reads 18 out of 100, firmly in “Bitcoin Season” territory. When the index falls below 25, it confirms Bitcoin’s dominance over the broader crypto market. This means crypto investor money is currently flowing into Bitcoin rather than other coins, collectively referred to as “altcoins.”
This bullish tilt gains further credence when considering that 57.7% of Myriad predictors expect BTC dominance to hit 70% rather than falling back to 58%—a clear vote of confidence in Bitcoin’s continued market leadership. “Bitcoin dominance” is another measure of where traders are placing their crypto bets: Bitcoin, or other coins such as Ethereum, Solana, and thousands of others.
Bitcoin to $115K or $95K? The battle of the channels
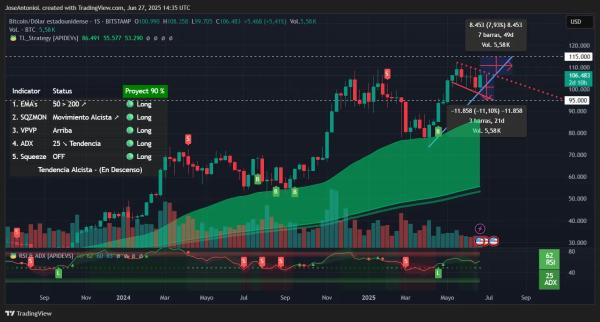 Bitcoin trading data. Image: TradingView
For those following the charts, the answer to Bitcoin’s next move may come on July 19. This date represents a critical technical inflection point where two opposing forces collide: the short-term bearish channel that’s been constraining prices since May 22 meets the long-term bullish channel supporting the rally since early April.
The magic number? $106,500 by mid July—if markets remain normal and no unforeseen event changes things dramatically.
If Bitcoin trades above this level by July 14, it signals that markets have decided to cancel the bearish correction, break past resistance (the dotted red line in the chart above), and resume the bullish trend toward new all-time highs (the solid blue line). The path to $115,000 would then be clear.
Conversely, if prices sit below $106,000 on that date, it suggests the bearish channel remains intact. In this scenario, $95,000 becomes the more likely target as the market continues its correction phase within the larger bullish structure.
That said, if you had to place a bet today, Bitcoin reaching $115,000 seems just a bit more likely in theory, but with an important caveat regarding timing. Here’s why:
First, it’s easier for BTC to spike 8% in 49 days than dip 11% in 21 days (sticking with the July 19 date, as opposed to end-of-year like Myriad has its market structure). Cryptocurrency markets tend to be volatile, and it is not unusual to see such moves happen in hours. However, all things being equal, less volatile changes over a longer time period are more likely to occur as they are more natural and less abrupt.
Also, Bitcoin traders are maintaining its current price above crucial support levels despite consolidation. Bitcoin is now in a “golden cross” formation, which means the average price of BTC over the last 50 weeks is greater than the average price over the last 200 weeks. And the widening gap between the two averages confirms the medium-term bullish structure.
But don’t lose track of the July 19 convergence at $106,500. If BTC stays above this level, which seems likely given current price above $107,000, the bullish scenario activates.
Bitcoin price: A technical analysis
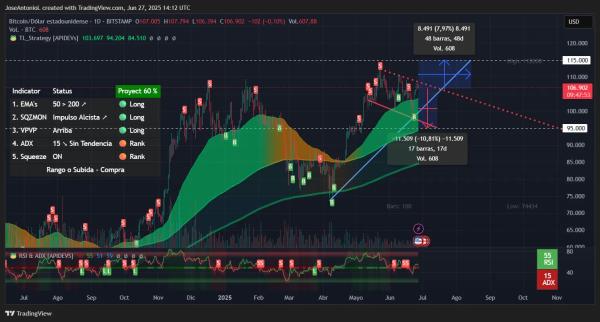 Bitcoin price analysis. Image: TradingView
Shorter time-frame charts usually present more noise than longer time-frame charts. However, usually trend changes are first reflected on these charts, so it’s important to check them even when considering longer-term positions. In the case of Bitcoin, the above chart presents a nuanced technical picture that demands careful interpretation, showing that prices are currently correcting inside of a broader, established bullish trend.
The Average Directional Index, or ADX, reads 15, well below the 25 threshold that confirms trend strength. This low reading indicates Bitcoin lacks strong directional daily momentum—the current price action represents more of a drift than a decisive move. For momentum traders, an ADX below 20 typically signals a ranging market where patience is required before the next trending move emerges.
The Relative Strength Index, or RSI, at 55 places Bitcoin in neutral ground. RSI measures the speed and magnitude of price changes to identify overbought or oversold conditions. Readings above 70 suggest an overheated market ripe for correction, while below 30 indicates oversold conditions that often precede bounces. Bitcoin’s mid-range reading shows balanced momentum—neither exhausted bulls nor dominant bears have taken control.
However, the drop from oversold levels of previous weeks is a sign that markets are struggling more to push prices than before.
Looking at the Exponential Moving Averages, EMAs for short, the 50-day EMA sits above the 200-day EMA, maintaining the bullish configuration. This alignment, where shorter-term averages stay above longer-term ones, traditionally signals sustained upward pressure. The widening gap between these averages confirms that despite recent consolidation, the medium-term trend remains decisively bullish.
The Squeeze Momentum Indicator shows “ON” status, suggesting volatility compression is currently occurring. This tool identifies a market condition that often precedes explosive moves. With the squeeze engaged, traders should prepare for a significant price movement once this compression releases.
In other words, day traders may have more reason to consider shorting Bitcoin than swing traders.
Disclaimer
The views and opinions expressed by the author are for informational purposes only and do not constitute financial, investment, or other advice.