This ‘highly accurate indicator’ sets XRP’s price next stop 
![]() Cryptocurrency Feb 26, 2025 Share
Cryptocurrency Feb 26, 2025 Share
XRP investors might need to wait longer for the asset to make a decisive breakout, as a reliable technical indicator suggests that more losses could be on the way.
Specifically, XRP’s TD Sequential indicator has flashed a sell signal, indicating that the asset might be setting up for further declines in the coming sessions, according to an outlook by prominent cryptocurrency analyst Ali Martinez in an X post on February 26.
Martinez pointed out that the indicator has accurately predicted XRP’s price direction since 2022.
Picks for you
ChatGPT says Solana price will hit this target by March 2025 3 hours ago MetaMask integrates 10 blockchains in crypto off-ramp expansion 3 hours ago Animoca Brands joins the MultiversX network, pushes EGLD forward 4 hours ago Wall Street performs record Bitcoin sell-off with ETFs — Is BTC bottom in? 5 hours ago
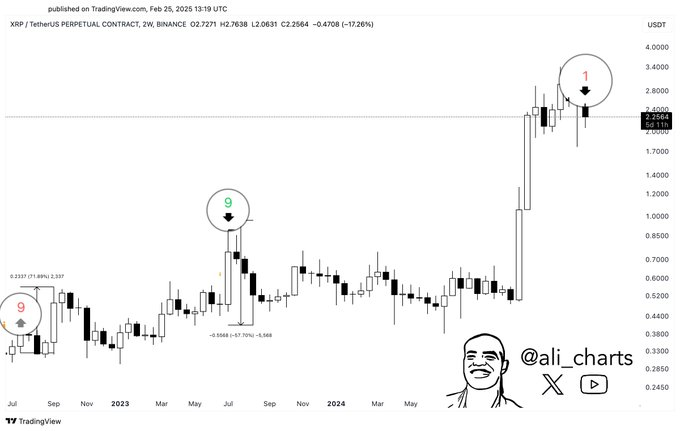
The TD Sequential identifies trend exhaustion and reversals. A ‘9’ candle signals an overextended trend, hinting at a pause or reversal, while a ‘1’ can mark a new cycle phase.
 XRP price analysis chart. Source: TradingView/Ali_charts
Martinez noted its accuracy in predicting XRP’s turning points, with past ‘9’ signals preceding pullbacks and earlier setups correctly calling rallies.
“The TD Sequential indicator has been highly accurate in predicting XRP price direction since 2022. It now flashes a sell signal on the 2-weeks chart, suggesting an impending correction,” Martinez said.
Indeed, if the pattern plays out, XRP will be at risk of breaching the $2 support, which has been central to investors’ hopes of the asset targeting a new record high. Initially, as reported by Finbold, Martinez warned that the asset was headed for a massive crash, with $1.6 as a possible target.
Whales fulling XRP’s crash
Although the overall cryptocurrency market crash has partly fueled XRP’s current sell-off, on-chain data complements Martinez’s analysis.
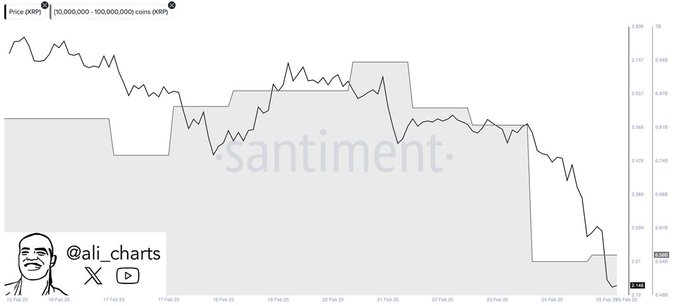
Specifically, in an X post on February 26, Martinez shared data from Santiment indicating that XRP’s large holders offloaded over 370 million tokens in just four days.
This massive sell-off suggests that major investors are either taking profits or hedging against further downside. Historically, whale activity has been a strong indicator of market trends, and if selling pressure persists, XRP could struggle to find immediate support.
 XRP whale transaction chart. Source: Santiment/Ali_charts
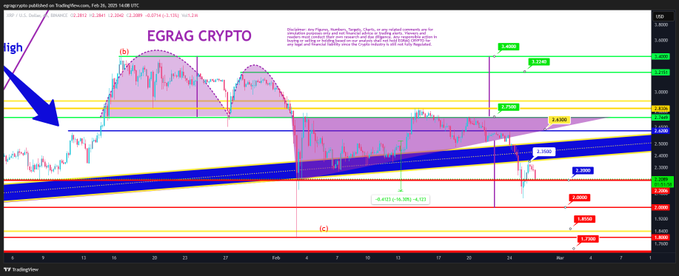
In the short term, cryptocurrency trading expert Egrag Crypto acknowledged that XRP is at a critical phase, with key levels to watch at $2.35 and $2.20.
 XRP price analysis chart. Source: TradingView
The expert highlighted that a close above $2.35 could reignite bullish momentum, pushing XRP back into its bull channel. However, a drop below $2.20 increases the risk of testing lower support at $2, where wicks are expected.
XRP price analysis
By press time, XRP was trading at $2.26, gaining over 3% in the last 24 hours. However, the asset has been down almost 13% in the past seven days.
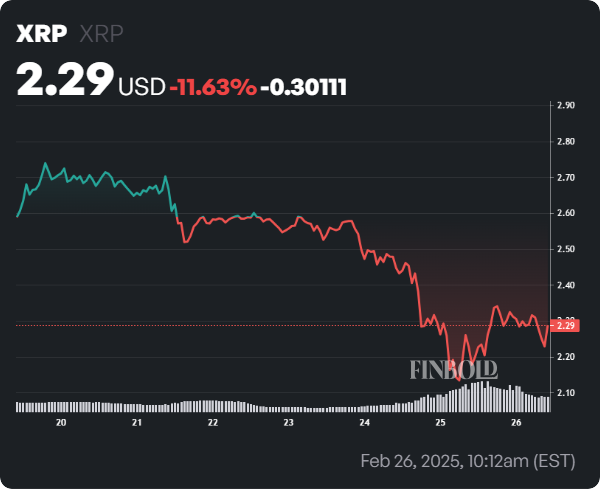 XRP seven-day price chart. Source: Finbold
XRP faces strong resistance below the 50-day simple moving average (SMA) of $2.69, but the long-term bullish outlook remains intact since the 200-day SMA stands at $1.47.
If the cryptocurrency market improves, the token could potentially make a decisive upward move. The market has been weighed down by uncertainty regarding elements such as the Donald Trump tariffs and Bitcoin’s bearish momentum.
In the long term, factors such as the possible approval of a spot XRP exchange-traded fund (ETF) could favor XRP.
Featured image via Shutterstock