Why Bitcoin’s next short-term target is $120,000 
![]() Cryptocurrency Jun 2, 2025 Share
Cryptocurrency Jun 2, 2025 Share
Although Bitcoin (BTC) is consolidating, a trading expert projects that the asset is poised to break out toward $120,000.
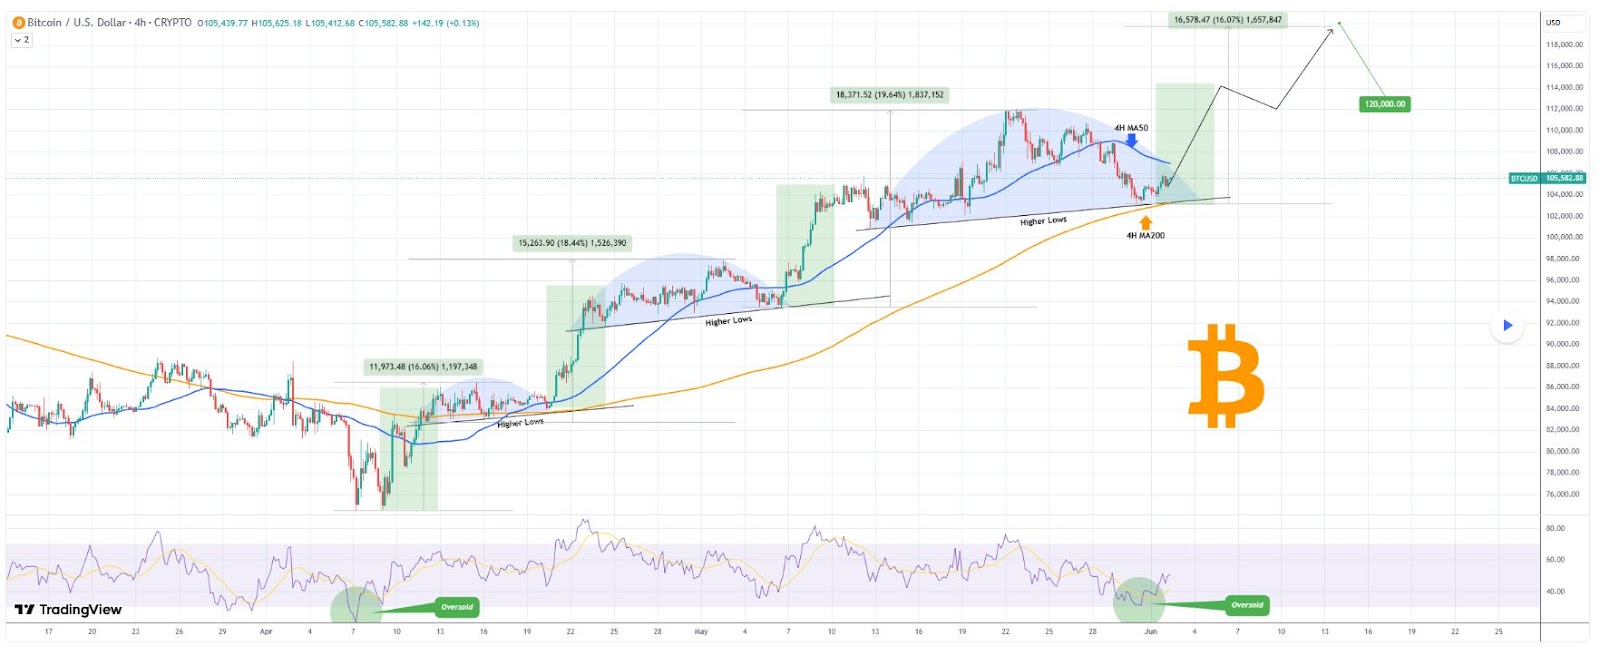
In this case, prominent online analyst TradingShot pointed out that Bitcoin nearly touched its four-hour 200-period moving average (MA) on Saturday, a critical support level since April 16.
In a June 2 TradingView post, TradingShot noted that after testing this level, BTC immediately rebounded. While the bullish reaction has been moderate since price action remains capped below the four-hour 50-period MA, there are compelling reasons to expect an imminent breakout.
 Bitcoin price analysis chart. Source: TradingView
Specifically, the formation of a blue Arc pattern over the past three weeks mirrors the price behavior seen during previous peaks and pullbacks since Bitcoin’s early April bottom. These Arc patterns have historically signaled significant upward momentum once the price breaks above resistance.
Adding to the bullish case, the four-hour Relative Strength Index (RSI) dipped into oversold territory for the first time since April 7. This condition suggests Bitcoin may be primed for a sharp reversal as buyers capitalize on discounted prices.
Bitcoin’s next price target
Even the weakest rally of this long-term bullish leg has seen gains of at least 16.06%. If the 4H MA200 continues to hold and Bitcoin breaks above the 4H MA50, TradingShot anticipates a minimum short-term rise of 16.06%, pushing BTC to approximately $120,000.
As reported by Finbold, TradingShot previously suggested that historical price movements indicate that Bitcoin could reach $200,000 by late 2025.
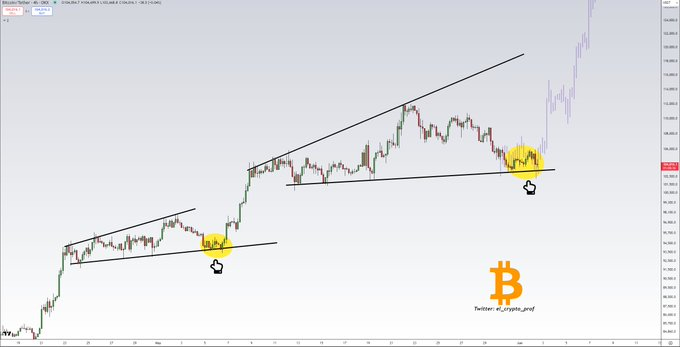
Meanwhile, pseudonymous analyst El_crypto_prof highlighted a familiar chart setup in an X post: a final small dip before a powerful surge.
With BTC hovering above $104,000, he identified $102,000 as a prime entry point and $97,000 as the critical floor for this bullish scenario to unfold.
 Bitcoin price analysis chart. Source: TradingView
Bitcoin price analysis
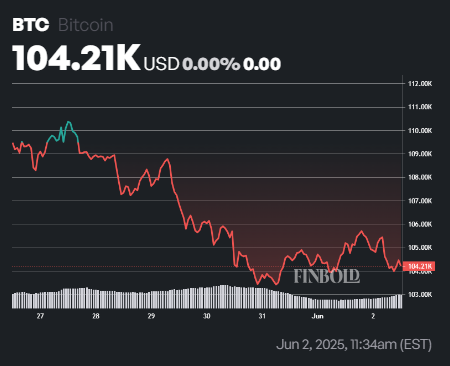
Bitcoin was trading at $104,212 at press time, down about 0.9% over the past 24 hours. On the weekly timeline, the asset was also down 2.8%.
 Bitcoin one-week price chart. Source: Finbold
Despite the consolidation, Bitcoin’s technical structure remains bullish, with the price significantly above its 50-day simple moving average ($98,885) and 200-day SMA ($86,995).
This alignment suggests a strong upward trend and sustained bullish momentum. Meanwhile, the 14-day RSI sits at 54.83, indicating neutral conditions.
Featured image via Shutterstock