XRP crash to below $2 back in play as $115 million moves to Coinbase 
![]() Cryptocurrency Jul 8, 2025 Share
Cryptocurrency Jul 8, 2025 Share
XRP traders are on high alert after a sizable amount of the asset was transferred to the cryptocurrency exchange Coinbase.
Blockchain tracking platform Whale Alert reported that 50.5 million XRP, valued at approximately $115.4 million, was moved from an unknown wallet to Coinbase on July 8.
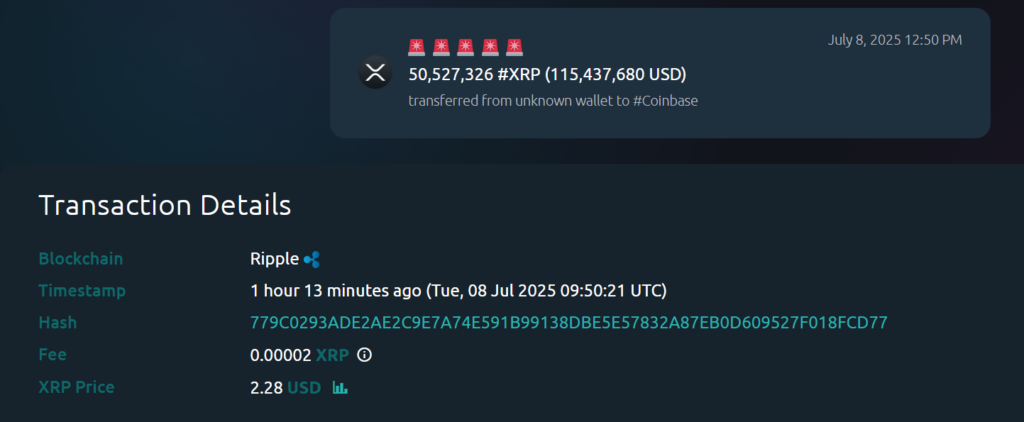 XRP transfer to Coinbase. Source: Whale Alert
Historically, large XRP deposits to centralized exchanges, such as Coinbase, have raised concerns about a potential sell-off, often putting downward pressure on prices.
If the sender intends to liquidate the holdings, it could intensify the struggle XRP is facing to hold above the key $2.30 resistance level.
However, some analysts caution against reading too much into the transfer. It could be part of internal rebalancing or a strategic liquidity move, rather than a precursor to a market dump.
XRP’s bullish play
Despite the uncertainty surrounding the transfer, technical indicators remain bullish. In this case, according to crypto analyst Ali Martinez, XRP has formed an inverse head and shoulders pattern over the past month, an historically reliable signal of a potential trend reversal.
The pattern, characterized by three troughs with the middle one (the “head”) being the deepest, suggests a transition from a downtrend to an uptrend.
$XRP is breaking out! pic.twitter.com/y5S8LdYgXG
— Ali (@ali_charts) July 7, 2025
According to Martinez, a confirmed breakout above the neckline at around $2.33 could validate the reversal and set the stage for a 12% rally, potentially pushing XRP to $2.60.
Such a breakout would reinforce bullish sentiment and likely attract more buyers around the asset.
XRP price analysis
As of press time, XRP was trading at $2.29, up 0.3% in the last 24 hours and 3.95% over the past week.
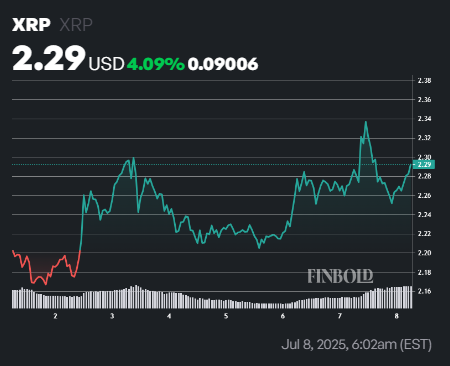 XRP seven-day price chart. Source: Finbold
The asset is currently trading above both its 50-day simple moving average (SMA) of $2.24 and its 200-day SMA at $1.80, signaling strength in both the short-term and long-term trends.
Meanwhile, the 14-day Relative Strength Index (RSI) stands at 56.93, indicating steady buying momentum without suggesting the asset is overbought.
Featured image from Shutterstock