Strong Chinese Yuan equals Bitcoin parabolic rally; Here’s why 
![]() Cryptocurrency Sep 30, 2024 Share
Cryptocurrency Sep 30, 2024 Share
Although Bitcoin (BTC) has slightly corrected its recent gains, which saw it get closer to the $66,000 barrier, its breakout above $60,000 was no small feat, and the flagship decentralized finance (DeFi) asset might initiate a parabolic rally phase, thanks to its correlation with the Chinese Yuan (CNY).
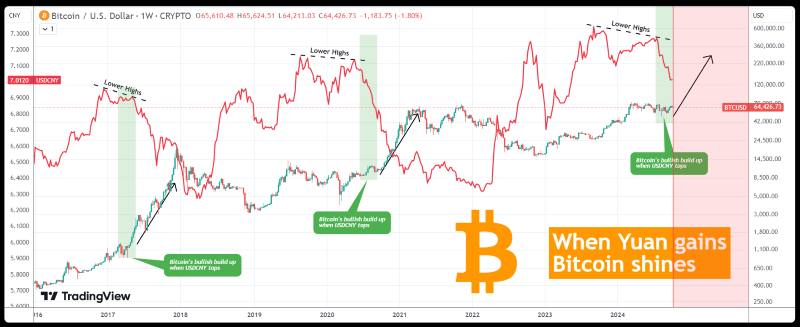
Specifically, Bitcoin has been building a strong bullish move since the August 5 bottom, and the reason might be the USDCNY pair reaching its top by forming lower highs and beginning to decline aggressively, according to the observations shared by markets analyst TradingShot in a TradingView post on September 30.
How Bitcoin relates to Chinese Yuan
As the pseudonymous trading expert further explained, history has shown that this is when Bitcoin “always initiates its Parabolic Rally phase” or, in other words, “when the Yuan gains strength, Bitcoin shines.” Furthermore, TradingShot noted just how strong the historical similarities are:
Picks for you
Crypto trader with 100% win rate nets $2.14 million in 7 weeks 3 mins ago Top 3 altcoins to turn $100 into $1,000 in October 4 mins ago Trump and Harris battle for the lead among crypto voters—Here’s who’s ahead 1 hour ago Top crypto executive builds 'Uptober' meme coin portfolio 2 hours ago
“The USDCNY’s previous Cycle in particular, is virtually identical to the current one (2022 – 2024). All the above indicate that we may be on the verge and witnessing the start of BTC’s most powerful part of the Bull Cycle.”
In fact, according to the chart shared by the analyst, similar developments occurred back in 2017 and 2020, and the current cycle was identical to the one in 2020 when the price of the maiden cryptocurrency initiated a rally right after the USDCNY pair reached its top.
 Bitcoin’s price performance analysis. Source: TradingShot
Bitcoin price analysis
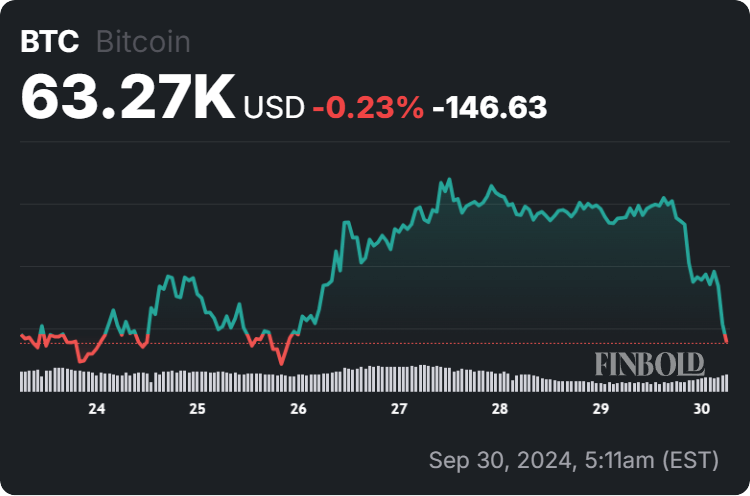
For the time being, Bitcoin is changing hands at the price of $63,270, which indicates a 2.98% decline in the last 24 hours, a loss of 0.23% across the previous seven days, but nonetheless a gain of 7.23% over the past month, according to the most recent chart information.
 Bitcoin price 7-day chart. Source: Finbold
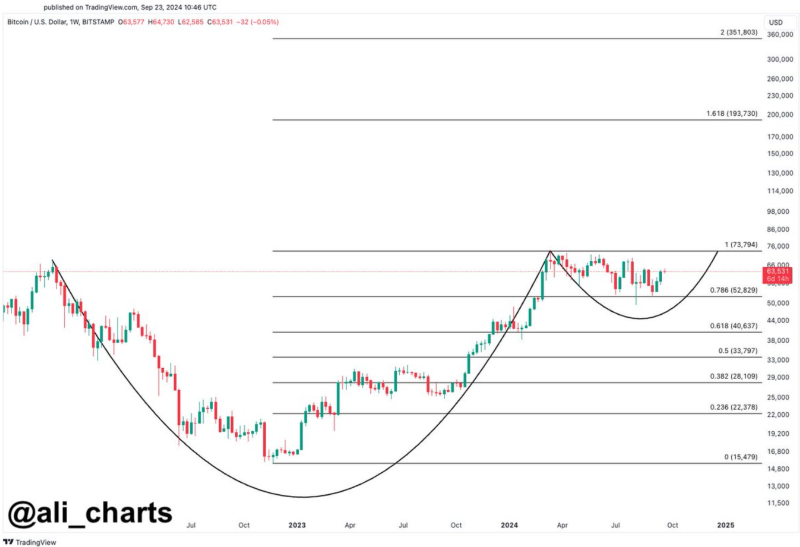
Earlier, prominent expert crypto trader Ali Martinez suggested that the largest asset in the crypto sector by market capitalization was building momentum toward a record high between $194,000 and $352,000, referring to the current price movement as “noise.”
 Bitcoin price performance analysis. Source: Ali Martinez
On the other hand, concerns remain over Bitcoin’s short-term price trajectory as online investor interest appears to be dwindling, evident in search volume levels lower than those witnessed even in the most challenging bear markets, as Finbold reported on September 29.
 Google search volume for Bitcoin. Source: Alex Becker
All things considered, Bitcoin might, indeed, be on the verge of a massive parabolic rally, particularly as other important indicators in addition to the Chinese Yuan are lining up as well, including bullish catalysts like Binance founder Changpeng Zhao’s release from prison.
However, trends in the crypto market might shift unexpectedly, so doing one’s own due diligence, including keeping up with any relevant developments, such as Bitcoin news prediction, and the like, is important when investing significant amounts of money in such assets.